The cell may be unchanged; the measurement boundary may not be
A cell reads 18.6 mΩ on the first measurement, 19.4 mΩ after reclamping, and 18.8 mΩ after it is moved to another channel. These results do not prove that the cell aged within minutes. An internal-resistance reading combines the impedance of the cell in a defined state with the response of the test system under a defined connection. If the contact position, force, surface condition, cable layout, or temperature changes, the measurement boundary has changed as well.
After comparing AC measurement, DC current-step measurement, EIS, and calorimetric methods, Schweiger et al. showed that a lithium-ion cell is not a simple linear resistor: its reported "internal resistance" depends on the method, time scale, SOC, and temperature [1]. In the same study, a 2 Ah cell at 25 °C and 60% SOC produced a 1 kHz AC result of 2.3 mΩ, while DC pulses of different durations produced substantially higher values. This does not mean that one method is necessarily wrong; the methods weight different electrochemical processes. What engineering practice must standardize is not a condition-free number, but the measurement definition.
1 kHz ACIR measures a high-frequency small-signal response
An AC resistance meter applies a small, fixed-frequency sinusoidal current to the cell and measures the amplitude and phase of the voltage response. Complex impedance is the ratio of the voltage phasor to the current phasor. Its real part, R, represents the dissipative component; its imaginary part, X, represents the capacitive or inductive response; and its magnitude, |Z|, is √(R² + X²). Depending on the instrument, the displayed "ACIR" may mean the real part R, series-equivalent resistance Rs, or impedance magnitude |Z|. The displayed parameter and calculation definition must therefore be confirmed before data are compared. Battery resistance meters commonly use 1 kHz because it provides a rapid high-frequency small-signal indicator that is sensitive to ohmic pathways and suitable for batch comparison [2,3].
%5C%2C%20%3D%5Cfrac%20%7BU(%5Comega%20)%7D%20%7BI(%5Comega%20)%7D%3DR(%5Comega%20)%5C%2C%20%2B%5C%2C%20jX(%5Comega%20))
%5D)
In many lithium-ion cells, the 1 kHz result is dominated by high-frequency ohmic pathways through the electrolyte, electrodes, current collectors, tabs, and interconnects. It is nevertheless a complex-impedance response at one specified frequency and is not necessarily identical to a strictly pure ohmic resistance. Slower charge transfer, pore-scale mass transport, and solid-state diffusion do not carry the same weight as they do in second-scale pulse measurements. Zhao et al. compared 1 kHz AC results with 10 ms, 2 s, and 30 s DC results for commercial LFP cells and supercapacitors, again showing that the measurement time changes the reported resistance [2]. ACIR is therefore useful for rapid screening and trend monitoring under controlled conditions, but it cannot directly replace the DCIR or hybrid pulse power characterization (HPPC) results needed to assess power capability.
A four-terminal connection removes lead-voltage drop, not every contact error
In a two-wire measurement, the same pair of leads supplies the test current and measures the voltage. The instrument therefore sees voltage drops across the leads and contact points on both sides; in the equation below, Rlead and Rcontact represent the total relevant lead and contact resistance in the measurement loop. A four-terminal method separates the Force current leads from the Sense voltage leads. Because the Sense input has a high impedance and draws very little current, the voltage drop generated by the Sense leads and their contact points is normally negligible. The measured voltage is therefore closer to the cell response between the two Sense sampling points [6].


Four wires, however, do not guarantee accuracy. If the Force and Sense paths merge inside the fixture before reaching the intended measurement boundary, the conductor or contact drop after the merge point still enters the result. If a probe slides across an oxide film, plating edge, or oily surface, the effective sampling point and current distribution may also change. An ideal four-terminal connection removes the direct contribution of Force-lead and Force-contact resistance to the voltage reading, but it cannot eliminate errors caused by Force/Sense geometry, current-spreading paths, the Sense sampling boundary, or unstable contact.
Fixture force, surface condition, and probe position determine reclamping error
A metal surface may look flat, yet current flows through only a small number of microscopic asperities. Increasing force usually enlarges the true contact area, breaks through part of the surface film, and reduces contact resistance. Excessive force, however, may damage a terminal, deform a pouch-cell tab, or shorten probe life. In an ideal four-terminal measurement, the resistance at a Force contact does not directly enter the Sense voltage. Changes in force still affect repeatability because they can alter contact stability, probe position, current spreading, and Force/Sense geometry. Taheri et al. showed that surface roughness, flatness, contact pressure, joint material, and interface material all affect contact losses in battery-assembly interfaces [5]. This establishes a general rule for metal contacts, but it is not a direct validation of reclamping error in a Kelvin fixture. "Squeeze it a little harder by hand" is therefore not a reproducible test method.
For cylindrical cells, the sampling positions on the positive cap and negative can bottom must be fixed. For pouch cells, tab insertion depth, clamping area, and clamping force must be controlled. For prismatic cells, the test boundary must distinguish among a bare terminal post, a bolted terminal, and a system boundary that already includes a busbar and weld. Each boundary may be meaningful for a particular engineering task, but values from different boundaries must not share the same batch acceptance limit.
At 1 kHz, a cable is more than just a piece of copper
In low-resistance DC measurement, attention often centers on conductor resistance. At 1 kHz, the loop inductance, cable capacitance, mutual inductance between adjacent conductors, and electromagnetic coupling from the Force loop into the Sense loop can all change the measured amplitude and phase. Schweiger et al. specifically warned that cable parasitics can produce erroneous high-frequency results when the wiring is poorly arranged [1]. In practice, Force and Sense conductors should be paired according to the instrument and fixture requirements, kept short and mechanically fixed, and prevented from forming large loops. The cable bundle should not be moved during measurement.
Zero compensation or short-circuit compensation corrects only the system state that existed when the compensation was performed. Compensation must be revalidated after replacing a fixture, extending a cable, adding a relay matrix, changing probes, or rearranging the wiring. On a production line, a calibrated low-resistance AC standard suitable for the target frequency should first be used to check instrument range and channel consistency. A state-controlled master cell, or "golden cell," can then be used to check the actual fixture and loading process. Because a golden cell drifts with temperature, SOC, and time, it cannot replace a metrological standard. Cross-checking is required to determine whether a deviation follows the cell, channel, or fixture.
Without consistent temperature and SOC, even the best fixture cannot make results comparable
Internal resistance is not a fixed identification number printed on the cell. Lower temperature slows ionic transport and interfacial kinetics, while changes in SOC alter electrode state and impedance distribution. Ahmed et al. examined LFP and lithium manganese nickel oxide cells from -20 °C to 50 °C and observed a clear dependence of broadband impedance on temperature and SOC [4]. The effect of SOC on the 1 kHz high-frequency real part may be weaker than its effect on DCIR or low-frequency impedance, and its magnitude depends on chemistry, cell design, and measurement settings. Sorting and trend analysis should nevertheless use consistent temperature, SOC, rest time, and measurement timing. A reading taken immediately after charging should not share the same acceptance limit as one taken after a two-hour rest.
For batch testing, record ambient temperature and periodically monitor cell surface temperature. For R&D comparisons, first bring all cells to the same SOC window, then rest them at the specified temperature until the project stability criteria for temperature and voltage change are satisfied. Rest time should not be treated as a universal number independent of chemistry and cell size. It should be established by a preliminary study: when extending the rest no longer materially changes the ACIR distribution, the waiting period is long enough to support the repeatability required by that project.
Turn a single reading into a traceable test process
First, lock the measurement definition: specify whether the output is the 1 kHz real part R, series-equivalent resistance Rs, impedance magnitude |Z|, or another algorithmic result, and fix the excitation frequency, range, averaging count, and trigger mode. Second, lock the sample state: standardize chemistry, specification, SOC, temperature, rest time, and measurement direction. Third, lock the connection boundary: define the Force and Sense contact positions, clamping force or travel, probe type, cleaning interval, and cable layout. Fourth, verify the system: before a shift, use a low-resistance AC standard suitable for 1 kHz to check the range and channels, then use a state-controlled golden cell to check the fixture and loading procedure. Recompensate after changing the fixture or cables.
A valid repeatability check must include several complete releases and reclamps of the same cell, not three consecutive readings while the fixture remains closed. Only the former exposes variation caused by contact position and force. Save each individual result together with the median, range, and fixture/channel identifiers. Production projects should also use a gage repeatability and reproducibility study, or an equivalent method, to confirm that measurement-system variation is much smaller than the tolerance band used for sorting. The allowable range must be set from the cell distribution and quality objective; a generic milliohm threshold should not be copied from another project.
Determine whether the anomaly follows the cell or the fixture
The most effective way to locate an anomaly is not to keep watching the same number, but to perform controlled swaps. First reclamp the cell on its original channel. Next exchange the fixtures used by the suspect cell and a normal cell. Finally move the same fixture to another channel. If the high resistance consistently follows the cell, attention can reasonably turn to the cell itself. If the anomaly follows a fixture or channel, inspect probe wear, contact force, cables, and compensation first. If the result jumps only after reclamping, the contact geometry is probably not under control.
Even when an anomaly follows the cell, 1 kHz ACIR should not diagnose failure by itself. It can indicate a change in an ohmic pathway or high-frequency impedance, but it cannot uniquely prove solid-electrolyte interphase (SEI) growth, lithium plating, an abnormal tab weld, or electrolyte deficiency. Confirmation should combine open-circuit voltage (OCV), capacity, DCIR, temperature rise, full EIS, or teardown analysis. Using ACIR as a rapid screening entry point rather than a final verdict reduces both missed defects and false rejects.
What equipment makes milliohm measurements trustworthy?
When cell resistance falls into the milliohm or even sub-milliohm range, the value of a test instrument is not simply that it displays more decimal places. It must make every measurement follow consistent rules for frequency, range, triggering, sampling, and calculation. A basic measurement may return only an isolated number. An instrument with stable excitation, multi-parameter analysis, statistical judgment, and automation capabilities can instead convert complex variation into recognizable and controllable data, establishing a reliable basis for fixture specifications, channel checks, and sorting limits.
The NEWARE BT-9562 high-precision battery internal resistance instrument uses a 1 kHz ± 0.02 Hz AC four-terminal method. The official specification gives an impedance range of 0-3 Ω and reports R, X, complex impedance, and phase angle. It also supports internal or external triggering, 1-16-reading averaging, statistical and judgment functions, and Ethernet, RS-232C, USB, and external I/O interfaces [7]. These capabilities help translate the fixture controls, channel checks, and sorting decisions described above into an automated workflow. Range and accuracy should still be selected according to cell impedance, rated voltage, and project tolerance rather than by looking only at the highest display resolution. For product details, see the NEWARE BT-9562 high-precision battery internal resistance instrument.
Unlike a test method that displays only one resistance value, the BT-9562 reports R, X, complex impedance, and phase angle for a more complete view of the high-frequency response. With 1-16-reading averaging and statistics and judgment functions including maximum, minimum, mean, standard deviation, Cp, and Cpk, R&D and production teams can identify persistent offsets and abnormal trends more quickly. Combined with standards and golden cells, these functions also help determine whether a problem is more likely to follow the cell, fixture, or measurement channel, reducing repeat tests, sorting errors, and unnecessary sample rejection.
In automated applications, the BT-9562 can coordinate with OCV equipment, battery test systems, and automatic sorting equipment through internal or external triggering, Ethernet, RS-232C, USB, and external I/O. Resistance, terminal voltage, SOC stage, cycle position, and sample identity can then enter one data chain, turning a milliohm-level reading into a comparable, judgeable, and traceable quality metric. For R&D retesting, cycle-process monitoring, and batch cell sorting, the BT-9562 provides not only resistance measurement, but also a practical foundation for standardizing test conditions, digitizing anomaly detection, and automating quality decisions.
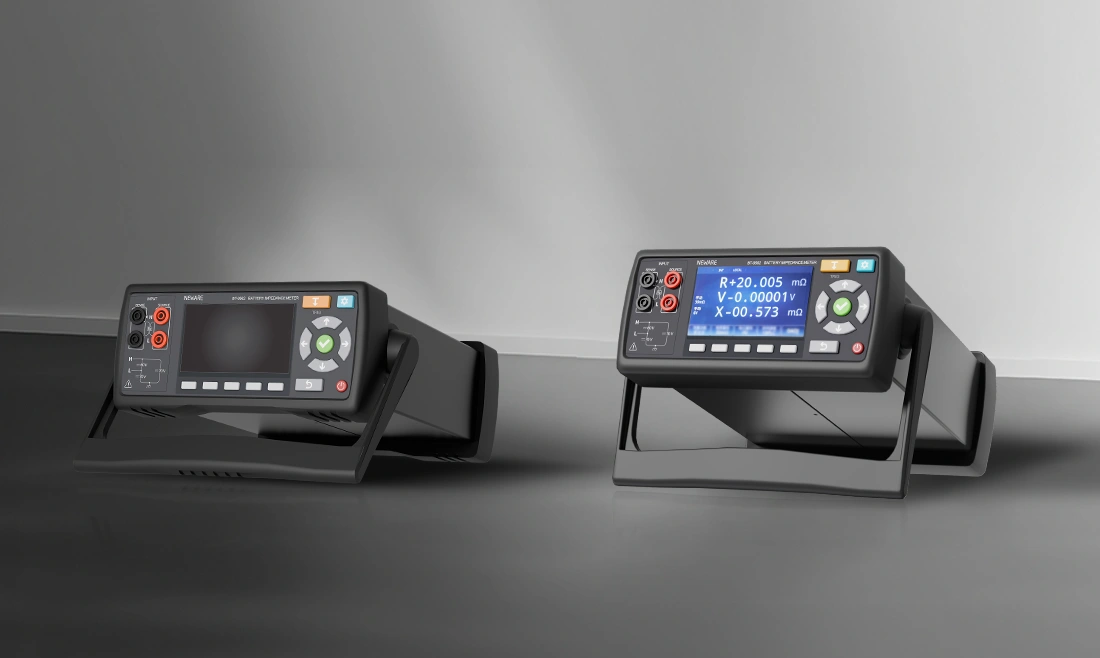
Figure 1. The NEWARE BT-9562 high-precision battery internal resistance instrument supports 1 kHz AC four-terminal resistance, terminal-voltage, and complex-impedance-related measurements.
Conclusion
A different reading after every reclamp first indicates that the measurement-system boundary has not been fully controlled; it does not prove that the cell itself is changing randomly. A 1 kHz ACIR measurement is useful for rapid, low-perturbation comparison of high-frequency impedance, but it is not equivalent to second-scale DCIR and cannot independently diagnose a failure mechanism. To make milliohm-level results useful, the measurement definition, Force/Sense positions, fixture force, surface condition, cable layout, temperature, SOC, and rest conditions must all be fixed. Reclamping, channel swapping, and golden-cell checks should then be used to identify the source of variation. Only after these controls are in place do the decimal places on the resistance meter have engineering meaning.
References
[1] Schweiger, H.-G.; Obeidi, O.; Komesker, O.; et al. Comparison of Several Methods for Determining the Internal Resistance of Lithium Ion Cells. Sensors 2010, 10(6), 5604-5625. https://doi.org/10.3390/s100605604.
[2] Zhao, S.; Wu, F.; Yang, L.; Gao, L.; Burke, A. F. A Measurement Method for Determination of DC Internal Resistance of Batteries and Supercapacitors. Electrochemistry Communications 2010, 12(2), 242-245. https://doi.org/10.1016/j.elecom.2009.12.004.
[3] Kuntinugunetanon, S.; Meesiri, W.; Wongkokua, W. Internal Resistance Measurements of Li-ion Batteries Using AC Methods. Journal of Physics: Conference Series 2021, 1719, 012045. https://doi.org/10.1088/1742-6596/1719/1/012045.
[4] Ahmed, S. H.; Kang, X.; Bade Shrestha, S. O. Effects of Temperature on Internal Resistances of Lithium-Ion Batteries. Journal of Energy Resources Technology 2015, 137(3), 031901. https://doi.org/10.1115/1.4028698.
[5] Taheri, P.; Hsieh, S.; Bahrami, M. Investigating Electrical Contact Resistance Losses in Lithium-Ion Battery Assemblies for Hybrid and Electric Vehicles. Journal of Power Sources 2011, 196(15), 6525-6533. https://doi.org/10.1016/j.jpowsour.2011.03.056.
[6] HIOKI E.E. Corporation. How to Measure a Battery's Internal Resistance with a Battery Tester and Other Measurement Applications. https://www.hioki.com/us-en/learning/usage/resistance-meters_2.html (accessed August 4, 2026).
[7] NEWARE. BT-9562 High Precision Battery Internal Resistance Instrument. https://www.neware.net/products/bvir/bt-9562/6.html (accessed August 4, 2026).