Rated capacity does not answer high-power load questions
First, separate two terms. Capacity, expressed in Ah or mAh, roughly describes how much charge is stored. Energy, expressed in Wh, is closer to how much useful work that charge can do. Because battery voltage changes during discharge, two batteries with the same capacity may deliver different amounts of energy under different loads.
Conventional constant-current discharge holds current fixed and is suitable for measuring basic capacity. Many devices do not use electricity that way. A motor needs to maintain speed, an inverter needs to maintain output, and a robot may need to complete one acceleration event. These loads behave more like a fixed power demand placed on the battery. As battery voltage falls, current must increase to maintain the same power.
One formula explains this clearly: Power P = voltage U x current I
Therefore, when power stays constant, current rises as voltage falls. Near the end of a constant-power discharge, the cell carries higher current, and voltage drop, heat generation, and polarization become more pronounced. This is why low-rate capacity alone can easily overestimate battery performance under real high-power loads.
What constant power discharge controls
In a constant-power discharge, the main setting is not "what current to use" but "what power to hold." The tester adjusts current in real time according to battery voltage so that voltage multiplied by current stays near the selected power. At the beginning of discharge, voltage is higher and the required current is lower. Later, as voltage drops, current automatically increases.
That is why constant-power testing must define the boundaries at the same time: the power setpoint, the minimum voltage for termination, the maximum allowed current, and the temperature-protection strategy. A typical sequence is constant-power discharge plus a rest/recovery step, followed by the next power point. In BTS work-step settings, CP DChg corresponds to constant power discharge; the key parameters include discharge power and cutoff conditions.

Figure 1. Example CP DChg work step in NEWARE BTS 8.0. The table shows both cutoff voltage and the Power (W) field.
A Ragone plot is an energy-power map
A Ragone plot can be viewed as a map: the horizontal direction shows whether the battery can provide higher power, while the vertical direction shows how much energy remains available at that power. Each point corresponds to one test result: how many Wh the battery actually delivered at a fixed power.
To compare batteries of different sizes, Ragone plots usually normalize power and energy by mass or volume. Using mass as the example:
Specific power = P / m
Specific energy = Edischarge / m
The tricky part is not the formula but what mass m includes. Using only active material gives a material-level value. Using the whole cell is closer to cell selection. Using a module or pack also includes structural parts, connectors, the battery management system (BMS), and thermal management. These levels cannot be compared directly; otherwise the plot may look impressive while the conclusion is wrong.
From an engineering perspective, the core purpose of a Ragone plot is to describe the usable energy an energy-storage device can provide under a constant active-power demand. When comparing devices, the test method, normalization basis, and application boundary must also be stated. That is what separates a Ragone plot from an ordinary rate-capacity curve: it does not only ask "how high is the current?" but asks "how much energy remains when output power is this high?"
Why usable energy falls as power rises
At high power, usable energy usually drops not because the battery has "lost capacity" all at once, but because it reaches a boundary earlier within the available voltage window. As current increases, ohmic drop, interfacial polarization, mass-transport limitations, and heat generation all become stronger, so terminal voltage approaches the cutoff voltage faster. Even if some lithium inventory in the electrodes has not been fully used, the test has already stopped because of voltage or safety limits.
Materials and structure also determine the energy-power trade-off. High-power cells often improve power capability by reducing impedance, shortening diffusion paths, and adjusting electrode loading and pore structure, but these choices often sacrifice part of the energy density. A Ragone plot is therefore not a simple ranking of which battery is "better"; it helps confirm whether a cell design suits the target application.
For R&D teams, the most valuable information is not a single maximum-power point but the shape of the whole curve. If a cell has high energy at low power but the curve falls sharply in the medium- and high-power region, it may fit long-runtime, low-load applications but not strong pulses or sustained high-rate discharge. If another cell has slightly lower low-power energy but a flatter high-power region, it may be better for power tools, drone climbs, robot acceleration, or fast-response energy storage.
Lock test boundaries before constant-power testing
Step one: unify the initial state. Before each constant-power discharge, use the same charging protocol, rest time, temperature, and state of charge (SOC). If the previous high-power step leaves obvious temperature rise or concentration polarization, the next test will carry that history.
Step two: set the power ladder. Power points should come from application requirements or sample safety limits, not arbitrary equal spacing. For small cells, start at lower power and increase gradually. For high-power samples, first use preliminary tests to confirm the current limit and temperature-rise boundary.
Step three: insert rest or recovery steps. After constant-power discharge, the battery needs time for voltage and temperature to recover. The rest condition does not have to be a universal fixed value; it should be defined according to the project's comparability requirement, such as voltage-change rate, surface-temperature recovery, or a specified rest duration.
Step four: record energy, not only capacity. The core outputs of a constant-power test are discharge energy, discharge time, average voltage, initial and final current, termination reason, and temperature change. Exporting only capacity removes the most important information from a power test.
Step five: normalize by a consistent mass or volume. Before generating the Ragone plot, specify whether the mass is cell mass, module mass, or active-material mass. For engineering selection, cell-level or system-level values should usually take priority, so material-level numbers are not mistaken for achievable device performance.
After testing, use BTSDA for a first data health check: whether the curves have abnormal jumps, whether steps ended as expected, and whether capacity, energy, and efficiency fields are complete. Constant-power testing ultimately has to rest on raw data that can be checked, traced, and exported. The measured screen below retains both curves and a step summary, making it easier to cross-check the work steps, curves, and data table together.
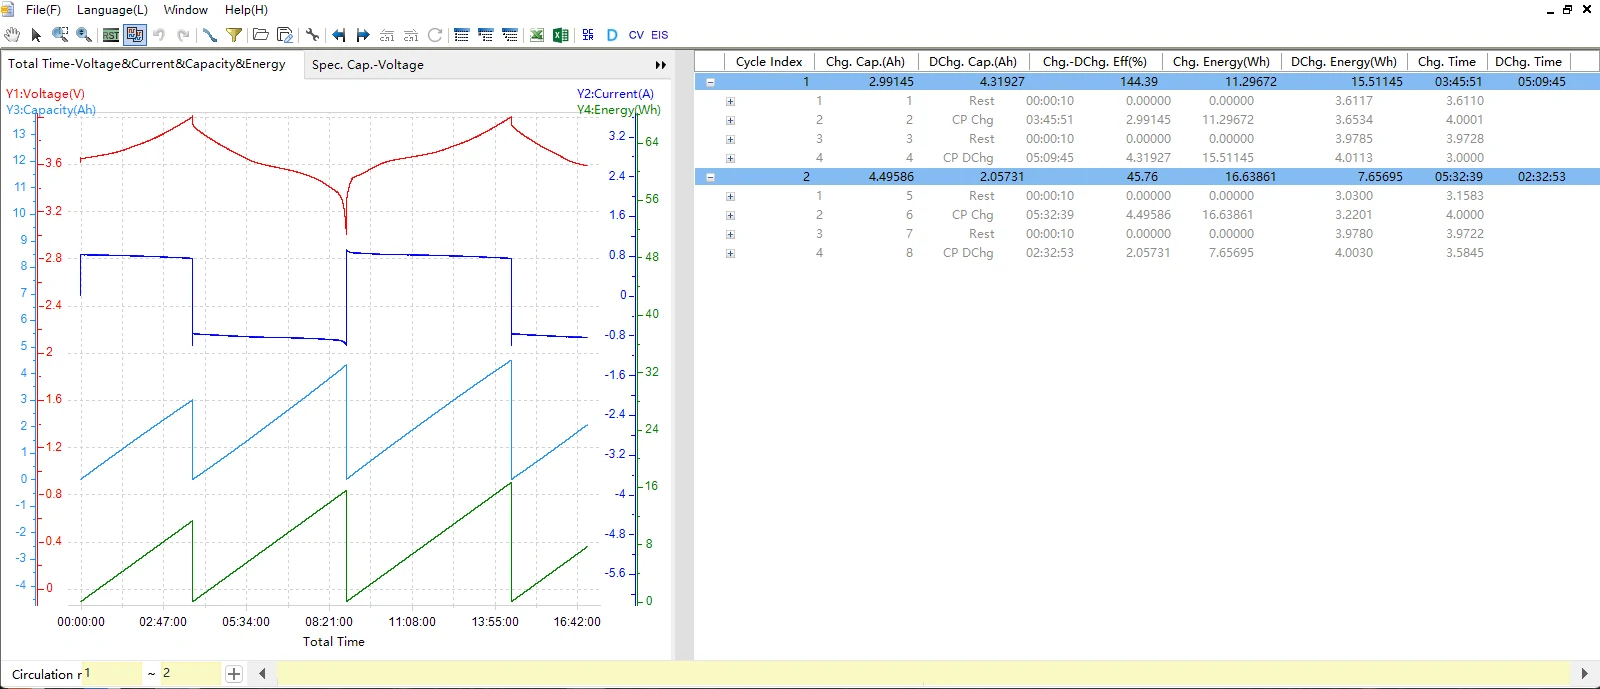
Figure 2. Measured 3 W constant-power charge/discharge data in NEWARE BTSDA. The left panel overlays voltage, current, capacity, and energy curves; the right panel lists cycle, step, time, and charge/discharge energy.
The associated raw .ndax file shows the following sequence: 10 s rest, 3 W constant-power charge to 4.0 V, 10 s rest, and 3 W constant-power discharge to 3.0 V, with a 2.8-4.2 V protection range. In the left plot, voltage rises and current gradually decreases during constant-power charge; during constant-power discharge, voltage falls and the absolute value of discharge current gradually increases. Both trends directly follow P = U x I.
The step summary on the right also highlights a common source of misreading. In the first cycle, discharge energy is about 15.51 Wh and discharge time is about 5 h 09 min, but the charge starting point of that cycle was not aligned with a complete discharge window. Therefore, the displayed 144.39% cannot be interpreted as the battery's real energy efficiency. The second-cycle discharge step was still running when the screenshot was taken, so those values are interim results as well. Before judging efficiency or comparing cycles, always confirm the starting SOC, step completeness, and termination reason.
From BTSDA data to a Ragone plot
A Ragone plot is not a scatter chart drawn by feel after a test. It is organized from complete data at multiple power points. After a finished discharge and a clearly defined mass basis, the 3 W record above can provide only one energy-power point. Repeating several 3 W cycles can check repeatability, but it cannot produce a Ragone curve. To obtain a curve, multiple CP DChg power points must be completed under the same starting SOC, temperature, cutoff condition, and rest strategy.
During data processing, first confirm the termination reason for each CP DChg step, then extract discharge energy, discharge time, average voltage, and temperature change. Next, divide the set power or measured average power by mass to obtain specific power, and divide discharge energy by the same mass to obtain specific energy. At higher power points, also check final current, temperature rise, and whether any protection was triggered.
For testers that support CC, CV, CP, CR, pulse charge/discharge, and related modes, the key to constant-power testing is to keep the work steps, protection conditions, and data fields fixed. In this workflow, BTS sets the work steps and boundaries, while BTSDA checks curves, selects fields, and organizes exported data.
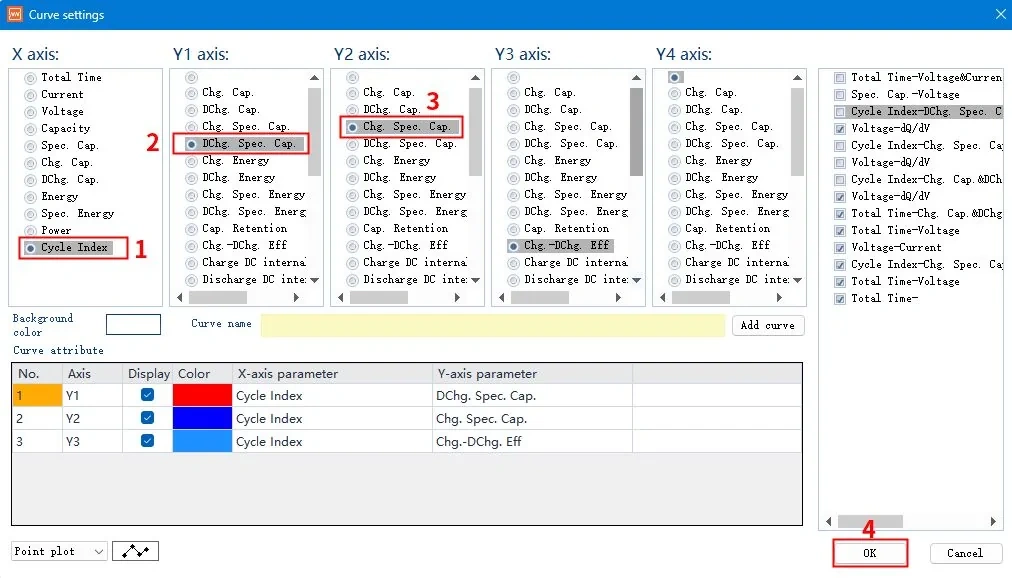
Figure 3. Example Curve settings screen in NEWARE BTSDA, where cycle number, capacity, energy, power, and other coordinate fields can be selected for curve analysis.
CC and CP can produce different Ragone curves
The literature figure below uses a lithium-ion cell model with a nominal capacity of 5.4 Ah and a mass of 0.305 kg to compare constant current (CC) and constant power (CP) discharge. At the same average specific power of 830.33 W/kg, the CC current stays at 75 A, while the CP current keeps increasing as voltage decreases. The higher end-of-discharge current causes stronger polarization, so CP discharge reaches the lower-voltage boundary earlier and usable energy drops faster in the high-power region.
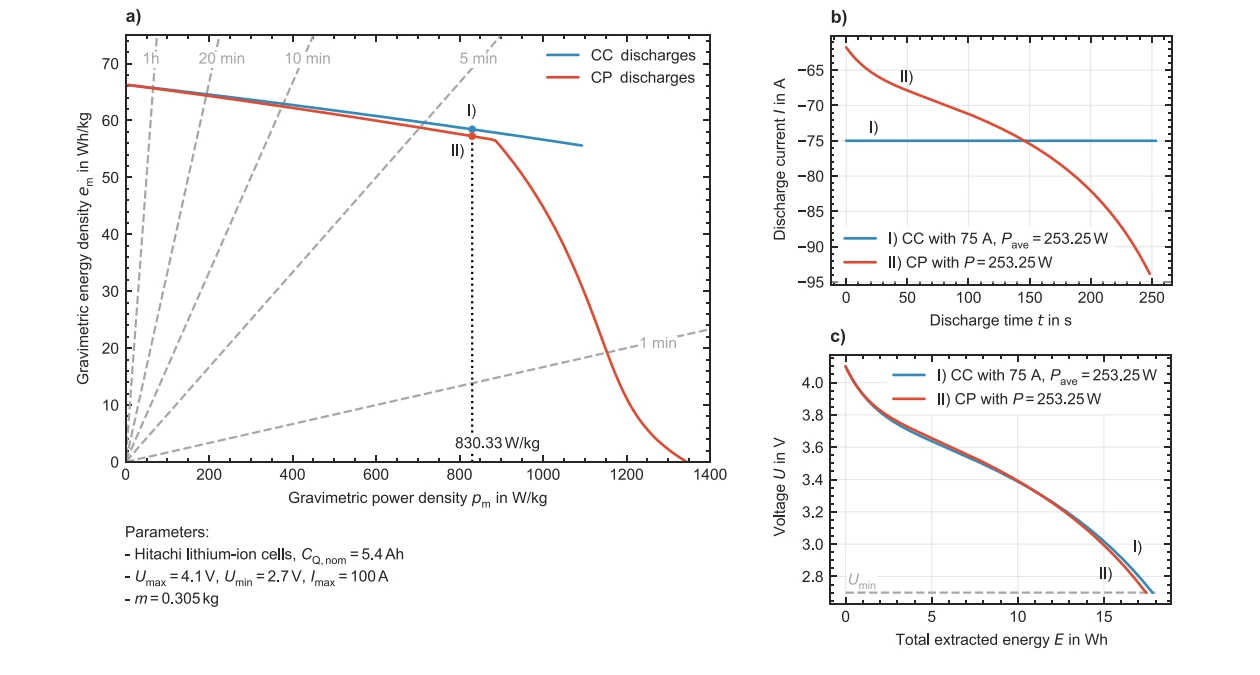
Figure 4. Comparison of CP and CC Ragone curves in a literature model: at high power, CP current increases as voltage falls and the curve bends downward earlier than the CC curve; the right side shows current and voltage-energy changes at the same average power point.
Reference: Beyers, I., Bensmann, A. & Hanke-Rauschenbach, R. Ragone plots revisited: A review of methodology and application across energy storage technologies. Journal of Energy Storage 73, 109097 (2023). https://doi.org/10.1016/j.est.2023.109097. Image license: CC BY 4.0.
This figure is a modeling demonstration, not a measured result from the NEWARE equipment used in this article, and it does not mean every cell will show the same difference. Its value is methodological: directly treating the average power of a CC discharge as a CP test result may overestimate usable energy in the high-power region. Therefore, any published Ragone plot must state the discharge mode. If the target load is close to constant power, complete CP discharge data should be preferred.
Common ways to misread Ragone plots
First, mixing different mass bases in one chart. Active-material, single-cell, module-level, and system-level values have completely different meanings. If several bases appear in the same plot, they must be clearly labeled; otherwise high energy-density numbers can mislead readers.
Second, forcing constant-current rate data into a Ragone plot. A constant-current discharge can be used to calculate average power and energy, but it is not the same as constant-power control. If the application is a fixed-power load, constant-power testing is preferable. If only constant-current data are available, the caption or body text should explain the calculation method and limitations.
Third, ignoring temperature. High-power discharge causes heat generation, while low temperature significantly increases polarization. Ragone plots, impedance, and pulse performance should all be evaluated together with temperature and load conditions, rather than from one room-temperature curve alone.
Fourth, looking only at the maximum power point. The maximum power point is usually shaped by voltage cutoff, current limit, temperature protection, and test-system capability together. Engineering selection should focus more on usable energy, temperature rise, repeatability, and safety boundaries in the target power range.
Constant-power testing and rate testing serve different purposes
Rate testing is suitable for comparing capacity retention of materials or cells under different currents, especially in research papers and initial performance screening. Constant-power testing is better for application questions: when a device needs 20 W, 100 W, or 2 kW, how long can the battery actually work, how many Wh can it deliver, and will the end current exceed the safety boundary?
Therefore, the two tests should not replace each other. Rate testing is more intuitive for comparing material kinetics. Constant-power testing and Ragone plots are closer to applications when comparing device runtime, power margin, and system selection. A complete project can first screen samples with constant-current rate testing, then confirm the target power range with constant-power ladder testing, and finally verify transient capability with pulse or dynamic duty-cycle tests.
Key takeaways
Constant-power discharge answers an application-side question: under a fixed power demand, how much energy can the battery still deliver, how long can it last, and where does it hit a boundary? It is related to constant-current rate testing, but it is not the same test.
In a Ragone plot, the horizontal axis is usually power density or specific power, and the vertical axis is usually energy density or specific energy. Before generating the plot, mass or volume basis, temperature, cutoff conditions, initial SOC, and rest strategy must be unified.
In practical testing, BTS can fix constant-power work steps, protection conditions, and rest sequences, while BTSDA can display voltage, current, power, energy, and related curves and export data. The work steps, curves, and exported fields need to correspond to each other so comparisons across power points are auditable and repeatable.
FAQ
Can a Ragone plot replace a rate curve?
No. A rate curve emphasizes capacity behavior under different currents, while a Ragone plot emphasizes the energy-power relationship under different power demands. They answer different questions. Use rate curves for material rate capability; use constant-power testing and Ragone plots for application power selection.
Why does current rise near the end of constant-power discharge?
Because power P equals voltage U multiplied by current I. When voltage falls late in discharge, the tester must increase current to maintain the same power. Without a current limit or temperature protection, the high-power endpoint may enter an unsafe or non-comparable region.
Does a Ragone plot have to use log-log axes?
Many Ragone plots use log-log axes because the energy density and power density of different energy-storage devices or battery designs can span wide ranges. If the comparison is limited to the same cell type over a narrow power range, linear axes can also be useful for internal analysis. For publication, the coordinate basis should be clearly stated.
Can constant-current data estimate a Ragone plot when constant-power data are unavailable?
Yes, for internal estimation, but it should not be treated as the final conclusion. Constant-current discharge can provide calculated average power and discharge energy, but it does not simulate the control process of a fixed-power load, where lower voltage demands higher current. If the target application is close to a constant-power load, CP DChg testing should still be added, and the caption should state power, mass basis, temperature, and cutoff conditions.