Identify the reaction represented by the profile
A galvanostatic charge–discharge profile reflects lithium-storage thermodynamics, reaction kinetics and cell design. Interpretation therefore starts with the working-electrode material, the direction of lithium insertion or extraction, and the axis definitions. This article focuses on half-cells with lithium-metal counter electrodes. Discharge of lithium iron phosphate corresponds to lithiation, whereas charge and discharge labels used for graphite can vary between publications and test-software conventions. For graphite, the terms lithiation and delithiation identify the reaction more reliably than the step label alone.
When the horizontal axis shows specific capacity, normalization should normally use the active-material mass. For a constant-current step, q = |I|Δt/m. With I in mA, Δt in h and m in g, q is expressed in mAh g-1. Active-material mass, total electrode mass and complete coin-cell mass are not interchangeable. Although the vertical axis is commonly labeled as potential versus Li⁺/Li, a two-electrode setup measures the voltage between the two electrode terminals. Once the lithium counter electrode polarizes appreciably, it cannot be treated as an ideal, invariant reference. Changes observed at high current or after prolonged cycling may therefore include a counter-electrode contribution. [1]
Plateaus and slopes provide clues to lithium-storage behavior
Near equilibrium, electrode potential is governed by the chemical potential of lithium in the host. When storage proceeds mainly through a change in the relative fractions of two coexisting phases, the chemical potential changes little and a relatively flat plateau may appear. Within a single-phase composition range, potential often varies continuously with lithium content, producing a sloping profile. These features suggest reaction behavior, but they cannot replace structural evidence when identifying a phase transformation.
Lithium iron phosphate illustrates this distinction. Its plateau is commonly associated with conversion between lithium-rich and lithium-poor phases, yet the reaction pathway also depends on current and particle characteristics. By combining operando X-ray diffraction with electrochemical impedance measurements, Hess and colleagues identified solid-solution contributions under nonequilibrium conditions. [2] A plateau becoming sloped is therefore insufficient evidence for a transition from a two-phase to a single-phase mechanism. That interpretation requires comparable test conditions and evidence of how phase composition evolves during the reaction. Likewise, multiple plateaus in graphite reflect different lithiation stages; each inflection should not automatically be assigned to a new side reaction.
Shorter plateaus indicate a change in accessible capacity
A plateau that becomes shorter along the capacity axis directly indicates less recorded capacity within that potential interval. This can result from a loss of accessible active material, but it can also occur when polarization drives the voltage to its cutoff before the material has reacted fully. These causes can produce similar profiles. Rate, voltage window, temperature, electrode loading and rest conditions should therefore be checked before attributing the change to material deactivation.
Figure 1 illustrates this ambiguity. Lithium iron phosphate electrodes with different porosities exhibit different slopes and end-of-discharge drops at 10C and 25 °C. The cells used lithium-metal counter electrodes and were first charged at 0.2C to 4.2 V, then discharged to 2.0 V. Transport limitations at lower porosity can terminate discharge earlier; higher porosity does not necessarily produce a higher voltage throughout the profile. [3] These curves compare electrode structures at high rate, rather than aging of one material over successive cycles. A shortened profile can therefore reflect incomplete utilization without establishing that the crystal structure has been damaged.
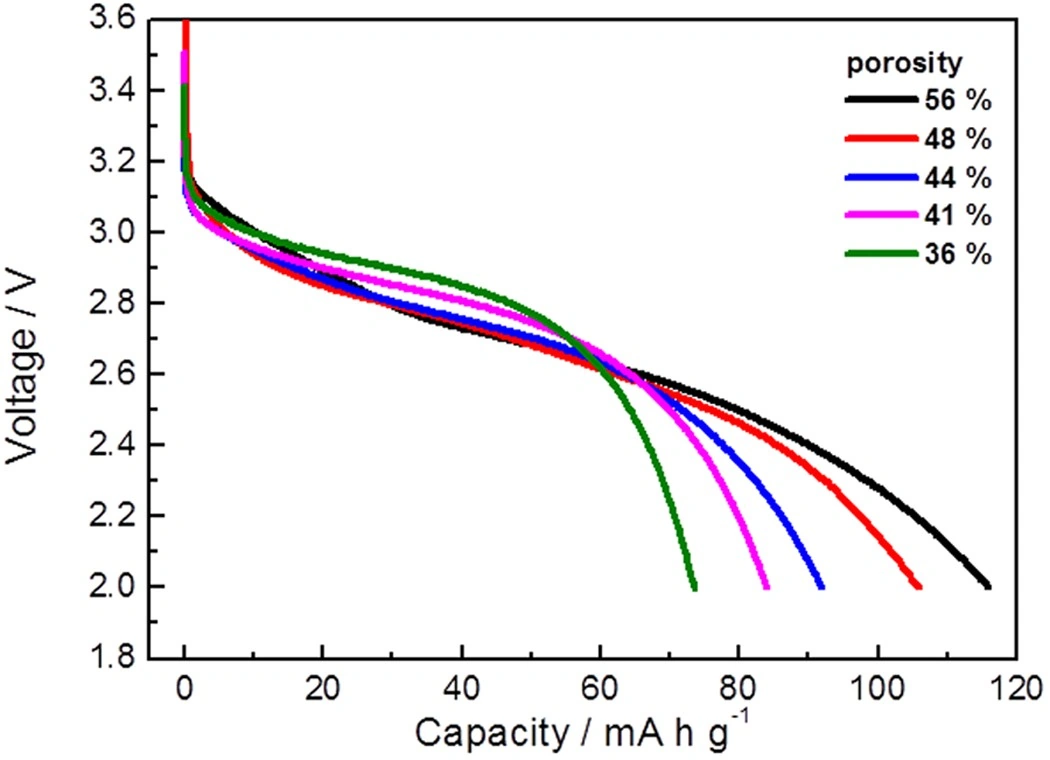
Figure 1. Half-cell discharge profiles of lithium iron phosphate electrodes with different porosities at 10C and 25 °C.
Separate polarization from voltage hysteresis
As current increases, ohmic losses, interfacial charge-transfer kinetics and mass-transport limitations drive the operating potential away from equilibrium. Over corresponding composition ranges in the same material, the lithiation branch generally shifts to lower potential and the delithiation branch to higher potential, widening their separation. Comparisons should be made at similar lithium contents or equivalent reaction stages. If reversible capacity differs between profiles, the same absolute capacity coordinate may no longer represent the same material state.
The voltage difference can also include hysteresis associated with nucleation, phase-boundary motion and different reaction pathways. Dividing the entire branch separation by current does not directly yield a material resistance, nor does the separation alone determine a lithium diffusion coefficient. If the shifts decrease substantially at lower current or after rest, kinetics contributed significantly to the original response. Persistent differences require closer examination of composition and path dependence. A nearly stable resting potential is not, by itself, proof of thermodynamic equilibrium.
Figure 2 compares graphite half-cells before and after photochemical interface modification. Panels b and c show first-cycle voltage and differential-capacity profiles; d and e show rate-dependent behavior, and a presents impedance at different lithiation stages. The reported electrode loading was 8.3 mg cm-2, and the initial test used 0.1C, equivalent to 35 mA g-1. In the rate sequence, lithiation current was varied while delithiation remained at 0.2C, followed by a return to 0.2C lithiation. [4] Interpretation should consider capacity recovery and voltage shifts when the rate is reduced, rather than only capacity at the highest rate. Recovery indicates that part of the high-rate capacity loss is reversible, although smaller irreversible changes may coexist.
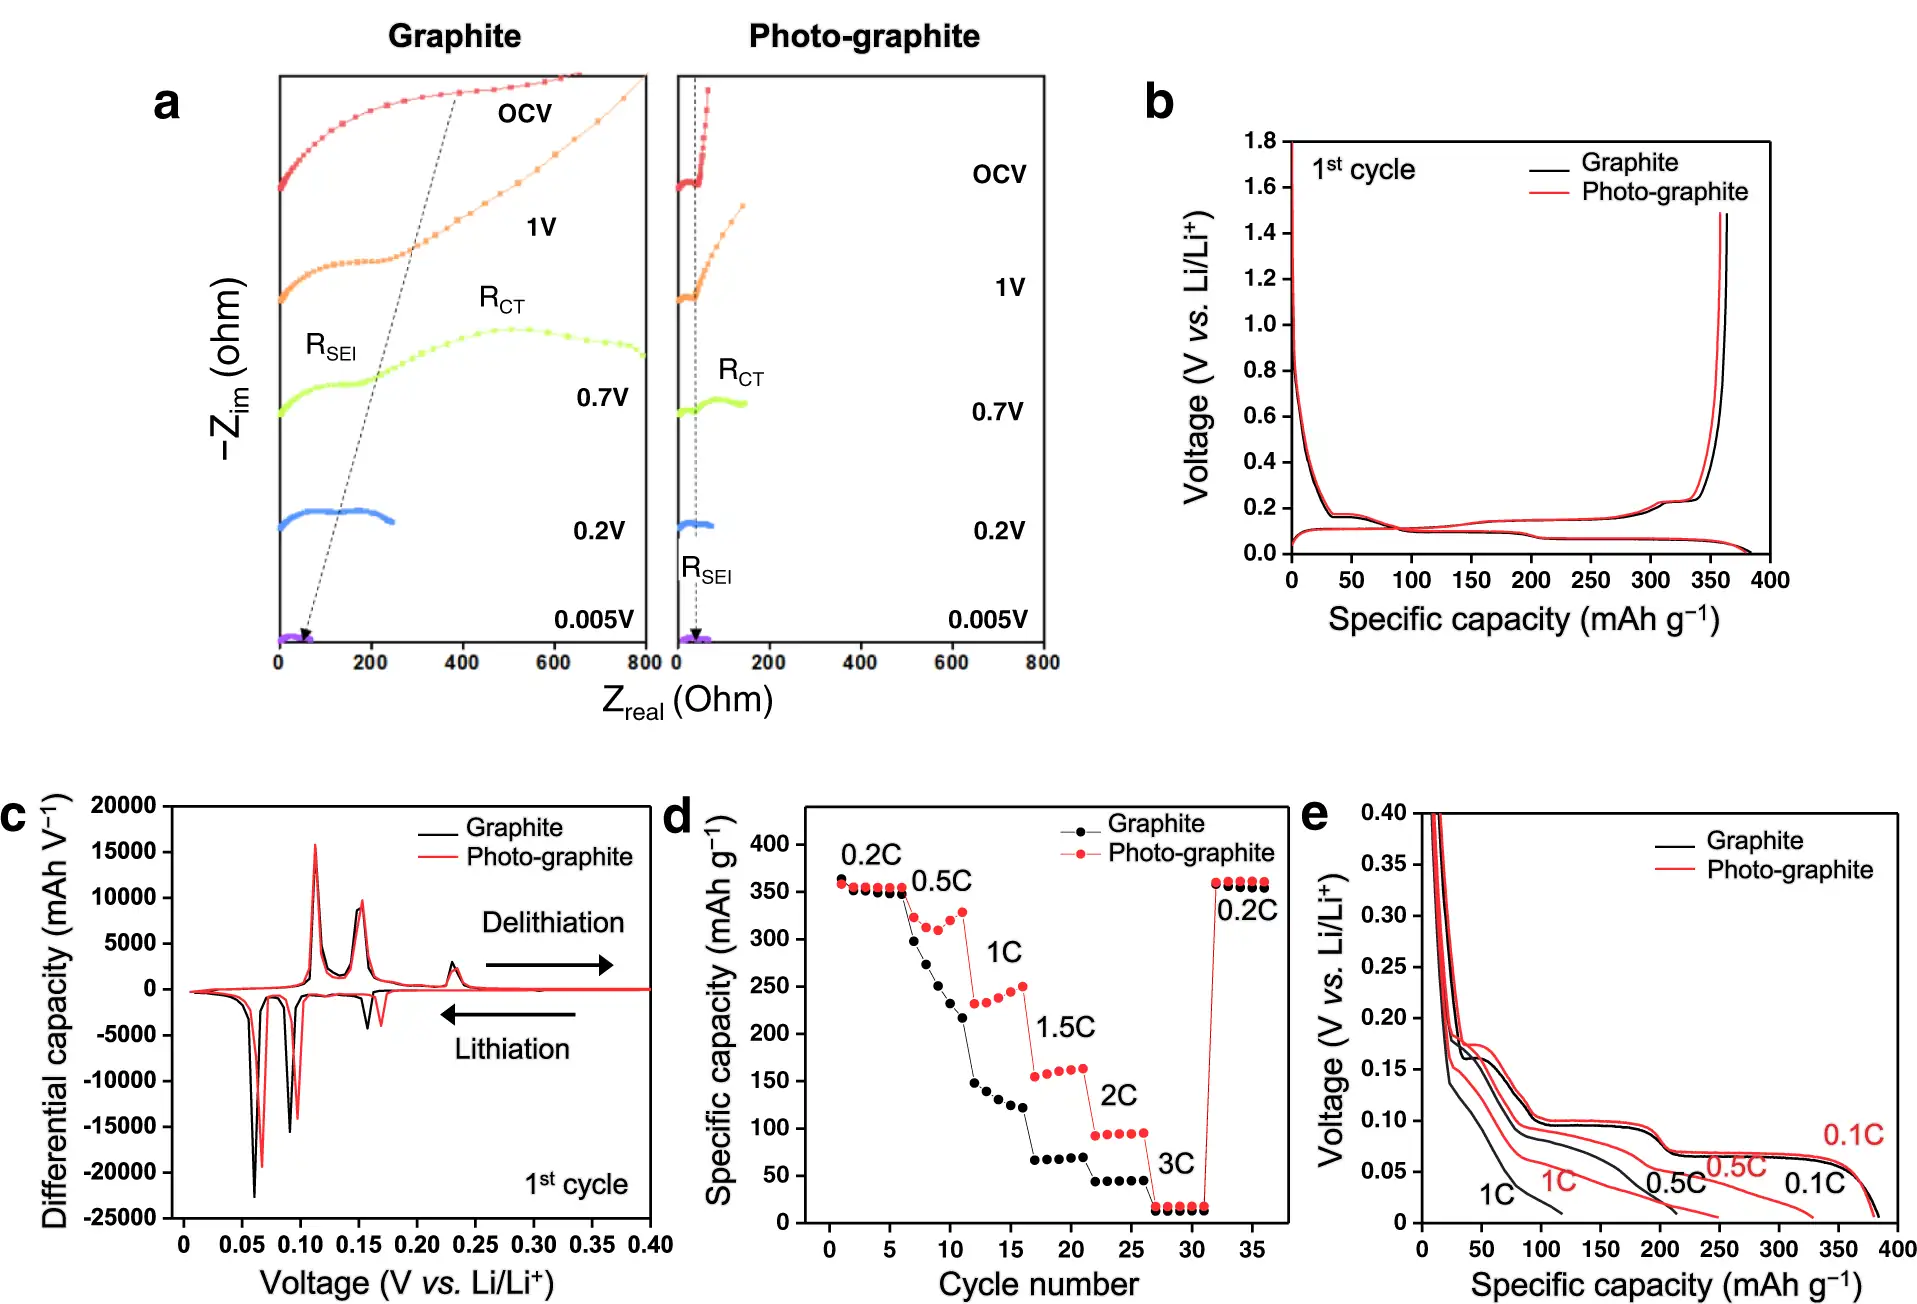
Figure 2. Electrochemical responses of graphite and interface-modified graphite half-cells, with all original panels a–e retained.
First-cycle irreversible capacity includes more than SEI formation
The first lithiation capacity of graphite often exceeds the capacity recovered during subsequent delithiation. Their difference characterizes first-cycle irreversible capacity within the specified test window. Contributions may include electrolyte reduction, solid electrolyte interphase (SEI) formation and lithium that is not extracted within the prescribed step. For a graphite half-cell starting with lithiation, initial Coulombic efficiency is the first delithiation capacity divided by the first lithiation capacity, multiplied by 100%. Reports should explicitly identify the reaction direction represented by the numerator and denominator.
A shoulder or sloping region that is prominent in the first cycle and then weakens may suggest initial interfacial reactions. However, that feature alone cannot quantify SEI mass, thickness or composition. A large first-cycle loss also warrants checking for differences in constant-voltage holds, cutoff current or reaction time. Similarly, subsequent Coulombic efficiency near 100% means that the input and recovered charges are similar within each cycle; it does not establish that the active material remains intact or rule out progressive loss of reversible capacity.
A disappearing plateau requires evidence beyond the curve
Under identical test conditions, a plateau that shortens, becomes more sloped or loses definition during cycling is consistent with several mechanisms, including loss of active-material connectivity, increasing interfacial resistance, poorer transport or a change in reacting phase fractions. The curve shows that the observable contribution of a lithium-storage process has changed, but rarely identifies the cause on its own. If the plateau becomes clearer at lower rate, reaction limitations at the original rate deserve particular attention. If it remains absent at low rate, further investigation of active-material accessibility and structural change is more strongly justified.
The measured voltage also reflects the collective response of particles and regions at different depths within the electrode. Figure 3, from the same study as Figure 1, uses Fe K-edge X-ray absorption information to examine reaction distributions across the electrode. [3] Similar average lithiation states can conceal different local reaction extents: some regions may approach their reaction endpoint while others remain underutilized. Electrode-scale heterogeneity should therefore be considered when a plateau broadens, tilts or ends early. Claims of crystalline phase transformation require evidence such as X-ray diffraction at comparable lithiation states. Electrochemical impedance spectroscopy can help examine interfacial resistance, but an impedance change cannot directly establish an increase in a particular interphase component.
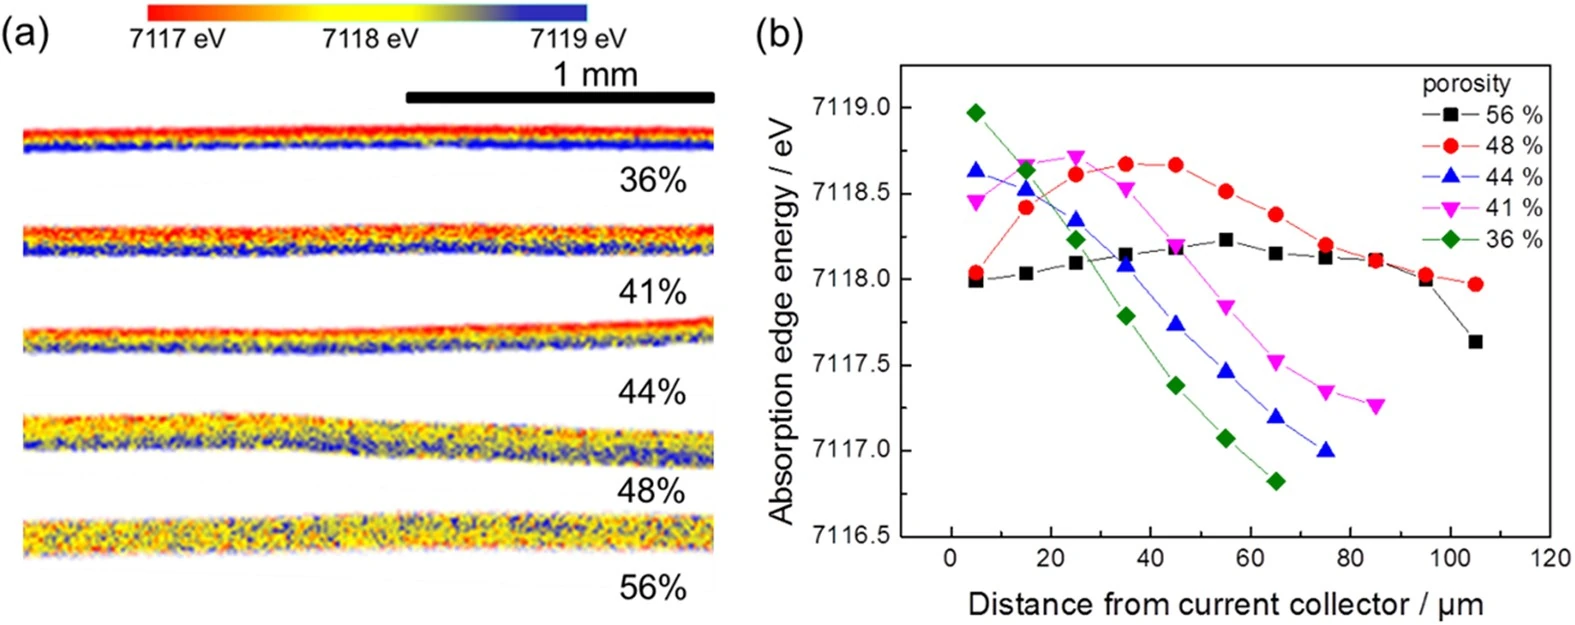
Figure 3. Cross-sectional reaction distributions in lithium iron phosphate electrodes of different porosities, providing spatial information beyond the overall voltage profile.
Make curve comparisons reproducible
Begin by matching conditions, then describe the curve features and test the proposed explanation. Keep the active-mass basis, loading, temperature, voltage limits, rest periods and constant-voltage termination criteria consistent, and report both the actual current and the definition of C-rate. Use a low-rate profile after formation as the baseline for comparing plateau position, capacity within selected intervals, slope and terminal shape. Returning to low rate after a rate sequence helps assess whether reduced capacity mainly reflects rate limitations. Comparisons before and after cycling should use the same reference procedure so that protocol changes are not mistaken for material evolution.
For differential-capacity analysis, dQ/dV, use sufficiently dense data and consistent processing, report the voltage increment and filtering method, and cross-check peak positions against the original voltage–capacity profiles. Differentiation amplifies noise, while excessive smoothing can merge neighboring features. State observations before interpretations: for example, “the lithiation plateau shifted to lower potential and capacity before cutoff decreased,” followed by “this is consistent with increased polarization.” Attribution to a specific material-state change requires adequate structural or interfacial evidence.
Using NEWARE equipment for half-cell profile analysis
For coin-type half-cells, the NEWARE CT-4008Q-5V100mA-124 battery tester can support the rate and cycling comparisons described above. NEWARE’s overseas product page specifies eight independently programmable channels, four current ranges spanning 0.2 μA to 100 mA, 10 Hz data recording, rate charging/discharging tests and dQ/dV analysis. Selecting an appropriate range for the sample mass and target current supports consistent acquisition across low-current baseline and rate-test steps. Instrument selection and programming must follow the specifications of the exact model; a full-scale accuracy specification should not be presented as an equivalent percentage-of-reading accuracy at every current.
A practical sequence comprises a low-rate baseline, higher-rate steps and a return to the baseline rate, with raw voltage, current, time and capacity data retained. For narrow plateaus or rapidly changing slopes, check that the recording interval preserves the relevant features before overlaying profiles or calculating derivatives. The tester provides controlled electrical inputs and traceable measurements; conclusions about phase transformations, interphase composition or local failure still require complementary characterization.
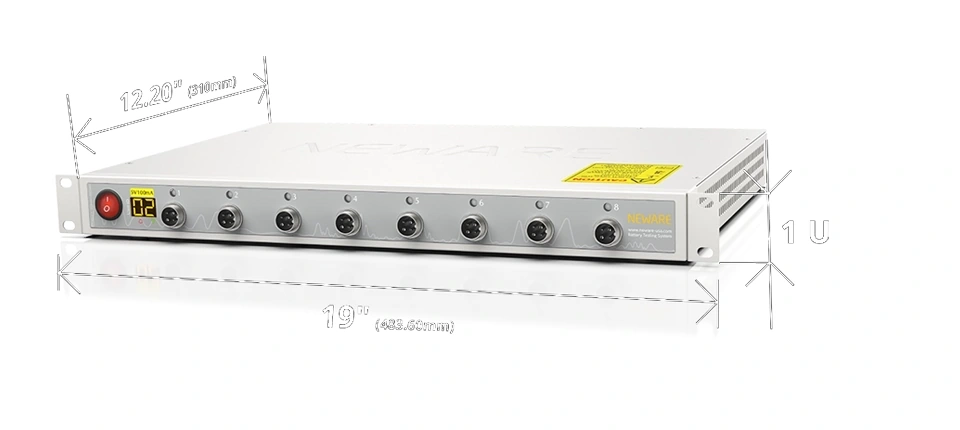
Figure 4. NEWARE CT-4008Q-5V100mA-124 battery tester shown on the corresponding overseas product page.
Conclusion
Half-cell voltage profiles reveal the potential ranges and extent of material participation under specified conditions. Plateaus, slopes, shifts and first-cycle differences offer clues to lithium-storage behavior, but intrinsic material changes, kinetic limitations, electrode structure and lithium counter-electrode responses can overlap. Comparable low-rate references, rate-recovery experiments and appropriate independent characterization turn these features into more reliable assessments of material behavior.
References
[1] Heubner C, Maletti S, Lohrberg O, et al. Electrochemical Characterization of Battery Materials in 2-Electrode Half-Cell Configuration: A Balancing Act Between Simplicity and Pitfalls. Batteries & Supercaps, 2021, 4(8): 1310–1322. https://doi.org/10.1002/batt.202100075
[2] Hess M, Sasaki T, Villevieille C, Novák P. Combined operando X-ray diffraction–electrochemical impedance spectroscopy detecting solid solution reactions of LiFePO4 in batteries. Nature Communications, 2015, 6: 8169. https://doi.org/10.1038/ncomms9169
[3] Orikasa Y, Gogyo Y, Yamashige H, et al. Ionic Conduction in Lithium Ion Battery Composite Electrode Governs Cross-sectional Reaction Distribution. Scientific Reports, 2016, 6: 26382. https://doi.org/10.1038/srep26382
[4] Baek M, Kim J, Jin J, Choi JW. Photochemically driven solid electrolyte interphase for extremely fast-charging lithium-ion batteries. Nature Communications, 2021, 12: 6807. https://doi.org/10.1038/s41467-021-27095-w