
A drop in resting voltage does not automatically mean a soft internal short
Even with no external load, slow parasitic reactions continue at the electrode-electrolyte interfaces of a lithium-ion cell, consuming cyclable lithium or stored charge. This irreversible loss of charge is self-discharge in the strict sense. In abnormality screening, the important question is not simply whether voltage has fallen, but whether a cell's sustained charge loss clearly departs from the normal range of its batch. A soft internal short can cause such behavior, but it is only one possible cause of elevated self-discharge.
Test equipment directly observes changes in open-circuit voltage (OCV), not the amount of charge lost inside the cell. In addition to true self-discharge, voltage relaxation, temperature changes, SOC differences, and leakage in the measurement system can all lower resting voltage. OCV decay and K-value are therefore screening signals first, not direct evidence of a soft internal short. This boundary must be clear before the mechanisms of normal self-discharge and soft internal shorts can be compared.
The fundamental difference between normal self-discharge and a soft internal short
Normal self-discharge mainly arises from distributed side reactions at the electrode-electrolyte interfaces. Its rate is usually low, and results from cells of the same model and batch tend to cluster within a relatively stable distribution when pretreatment, SOC, temperature, and measurement window are consistent. A soft internal short, by contrast, introduces an additional electronic conduction path inside the cell. Possible causes include a metal particle bridge, an electrode burr penetrating the separator, local separator damage, or a conductive path that develops during cycling. This path bypasses the intended electrochemical route and continuously drains charge; in more severe cases, it may also generate local Joule heating. The electrical and thermal responses can vary widely with short location, contact material, and contact area [4,5].
In diagnostic models, the fault path is commonly represented as a short-circuit resistance, RISCr, connected in parallel with the cell, as shown in Figure 1. A lower RISCr generally produces a larger additional leakage current. However, no universal resistance or current threshold defines a soft internal short across all cell designs. An early fault may appear only as a few extra millivolts of decline over several days compared with peer cells. Intermittent contact may also make the voltage trajectory appear normal at times and abnormal at others. Temperature and internal resistance may show no immediate change, so the absence of detectable heating does not rule out a soft internal short.
Figure 1 therefore explains why a soft internal short appears as additional self-discharge; it does not provide a circuit threshold that can directly classify a cell as faulty. Engineering screening should determine whether a cell persistently departs from its batch baseline, whether the anomaly can be reproduced after reconnection and repeat measurement, and whether a second signal—such as capacity loss, compensation current, internal resistance, or temperature rise—provides consistent evidence. With this logic established, an appropriate self-discharge method can then be selected to separate abnormal cells from normal variation.
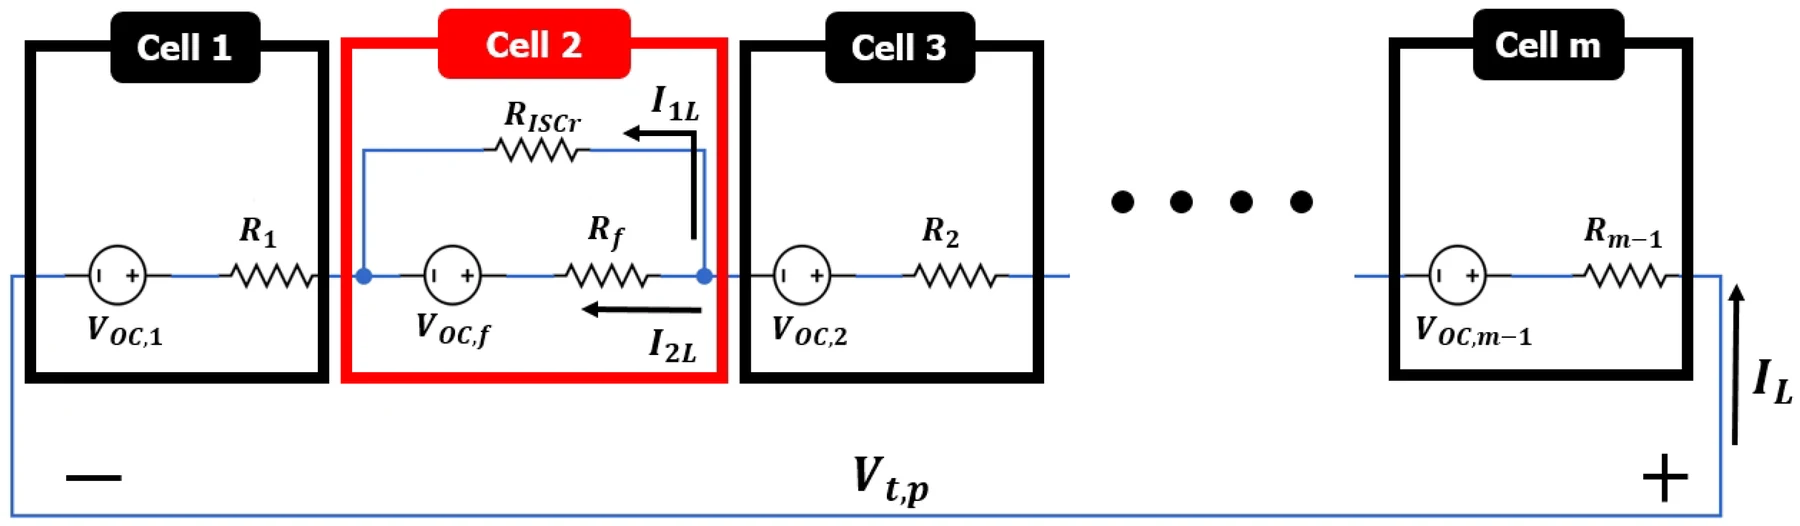
Figure 1. A soft internal short can be modeled as a resistance, R_ISCr, in parallel with the faulty cell, creating an additional self-discharge current. This model explains the leakage mechanism but is not, by itself, a fault criterion.
How self-discharge tests identify abnormal cells
OCV decay and k-value: the most common high-throughput screen
In production, cells are commonly adjusted to a specified SOC, allowed to rest in a temperature-controlled environment, and measured for OCV at two or more time points. The voltage-decay rate is often called the K-value and can be expressed as K = (V1 - V2)/(t2 - t1), typically in mV/day. When cells in the same batch share identical pretreatment, temperature, rest time, and measurement interval, samples with unusually high K-values can be routed for retesting or isolation.
This method uses relatively simple equipment and can process many cells in parallel, but it measures voltage change rather than leakage current directly. The OCV-SOC relationship depends on chemistry and SOC range. On a flat voltage plateau, the same capacity loss may produce only a small voltage change; on a steep portion of the curve, a small SOC change can cause a noticeable voltage drop. Deutschen et al. studied voltage decay in NMC/graphite cells for as long as 160 days at different temperatures and SOC levels, showing that time, temperature, and initial state must be included in both the model and the experimental design [2].
Capacity-loss method: measure how much charge is missing
The capacity-loss method uses standardized charge-discharge tests to measure releasable capacity before and after storage, bringing the measurement closer to the practical question: how much charge was actually lost? It helps distinguish a mere voltage change from genuine capacity loss, but requires a longer test and is affected by cycling measurement error, cutoff conditions, and cell aging. It is generally more convincing than a single OCV point for R&D validation or abnormal-sample review. For large-scale production grading, accuracy must be balanced against throughput and inventory occupancy.
Potentiostatic compensation current: replacing internal loss with external current
Another approach uses a highly stable source to hold the cell at a specified voltage. Once the system approaches equilibrium, the small compensation current required to maintain that voltage can be used to estimate self-discharge current. This is closer to a direct measurement than OCV decay, but it places higher demands on source stability, current resolution, temperature control, wiring leakage, and stabilization time. If the voltage is still relaxing, the measured current includes the current needed to restore equilibrium, not just abnormal leakage. Al-Zubaidi R-Smith et al. built a compensation measurement system using a regulated source and a microammeter, and calibrated line resistance to reduce the time required to establish steady state. The key is not simply to read a small current, but first to control voltage matching, line resistance, and temperature variation.
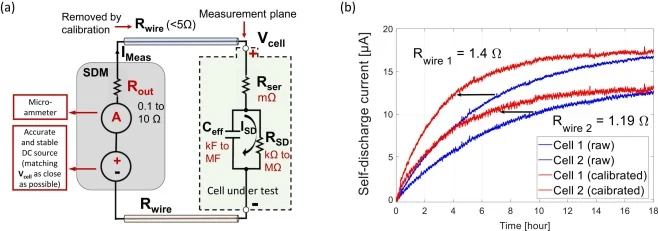
Figure 2. Principle of potentiostatic compensation-current measurement and an example of line-resistance calibration. A regulated source offsets the cell voltage, while a microammeter measures the compensation current required to maintain it.
Fast testing: shorten the wait, not the validation
Conventional storage tests often take days or even weeks. Schmidt et al. proposed a pulse-based method to quantify self-discharge and calculate an equivalent self-discharge resistance from OCV changes. Under their study conditions, the measurement was about 60 times faster than a 30-day calendar test, while storage experiments were still used for validation [3]. The work shows that higher measurement resolution, appropriate excitation, and a suitable model can reduce waiting time, but fast results still require correlation validation for the specific chemistry, format, SOC, and temperature range. A related 15-hour test on 21 commercial 4.7 Ah cylindrical cells measured self-discharge currents of approximately 3-6 μA at 23 °C and 30% SOC, demonstrating that microampere-level differences can be resolved under controlled conditions, although the curves still need time to approach steady state.
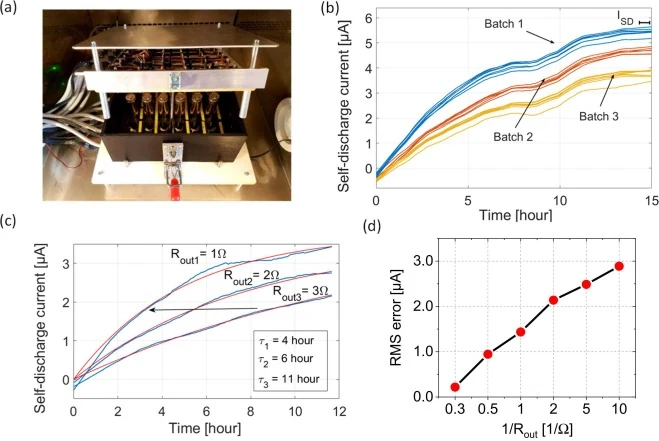
Figure 3. Convergence of self-discharge current during a 15-hour measurement of 21 commercial cylindrical cells. Curves from different batches show resolvable differences at the microampere level.
False positives in soft-short screening: relaxation, temperature, and measurement error
OCV-decay and K-value methods detect abnormalities through changes in terminal voltage. Any voltage change not caused by sustained leakage can therefore create a false positive. Voltage relaxation is the first interference that should be excluded after testing begins.
Immediately after charge or discharge, the internal lithium-ion concentration, electrode potentials, and polarization state have not fully equilibrated. After current is removed, these states continue to redistribute, changing OCV for several hours. This does not mean that an equivalent amount of charge has been lost through a leakage path. Roth et al. found that short-term voltage relaxation and long-term equilibration of the anode overhang after formation can both interfere with self-discharge measurements [1]. Azzam et al. performed approximately 150 days of potentiostatic measurement and modeling on three cell types, estimating a polarization time constant of about 7-14 hours and an anode-overhang equilibration time of about 3-30 days. As Figure 4 shows, these processes span time scales from hours to tens of days, so a fixed 24-hour rest should not be treated as a universal starting condition for every cell.
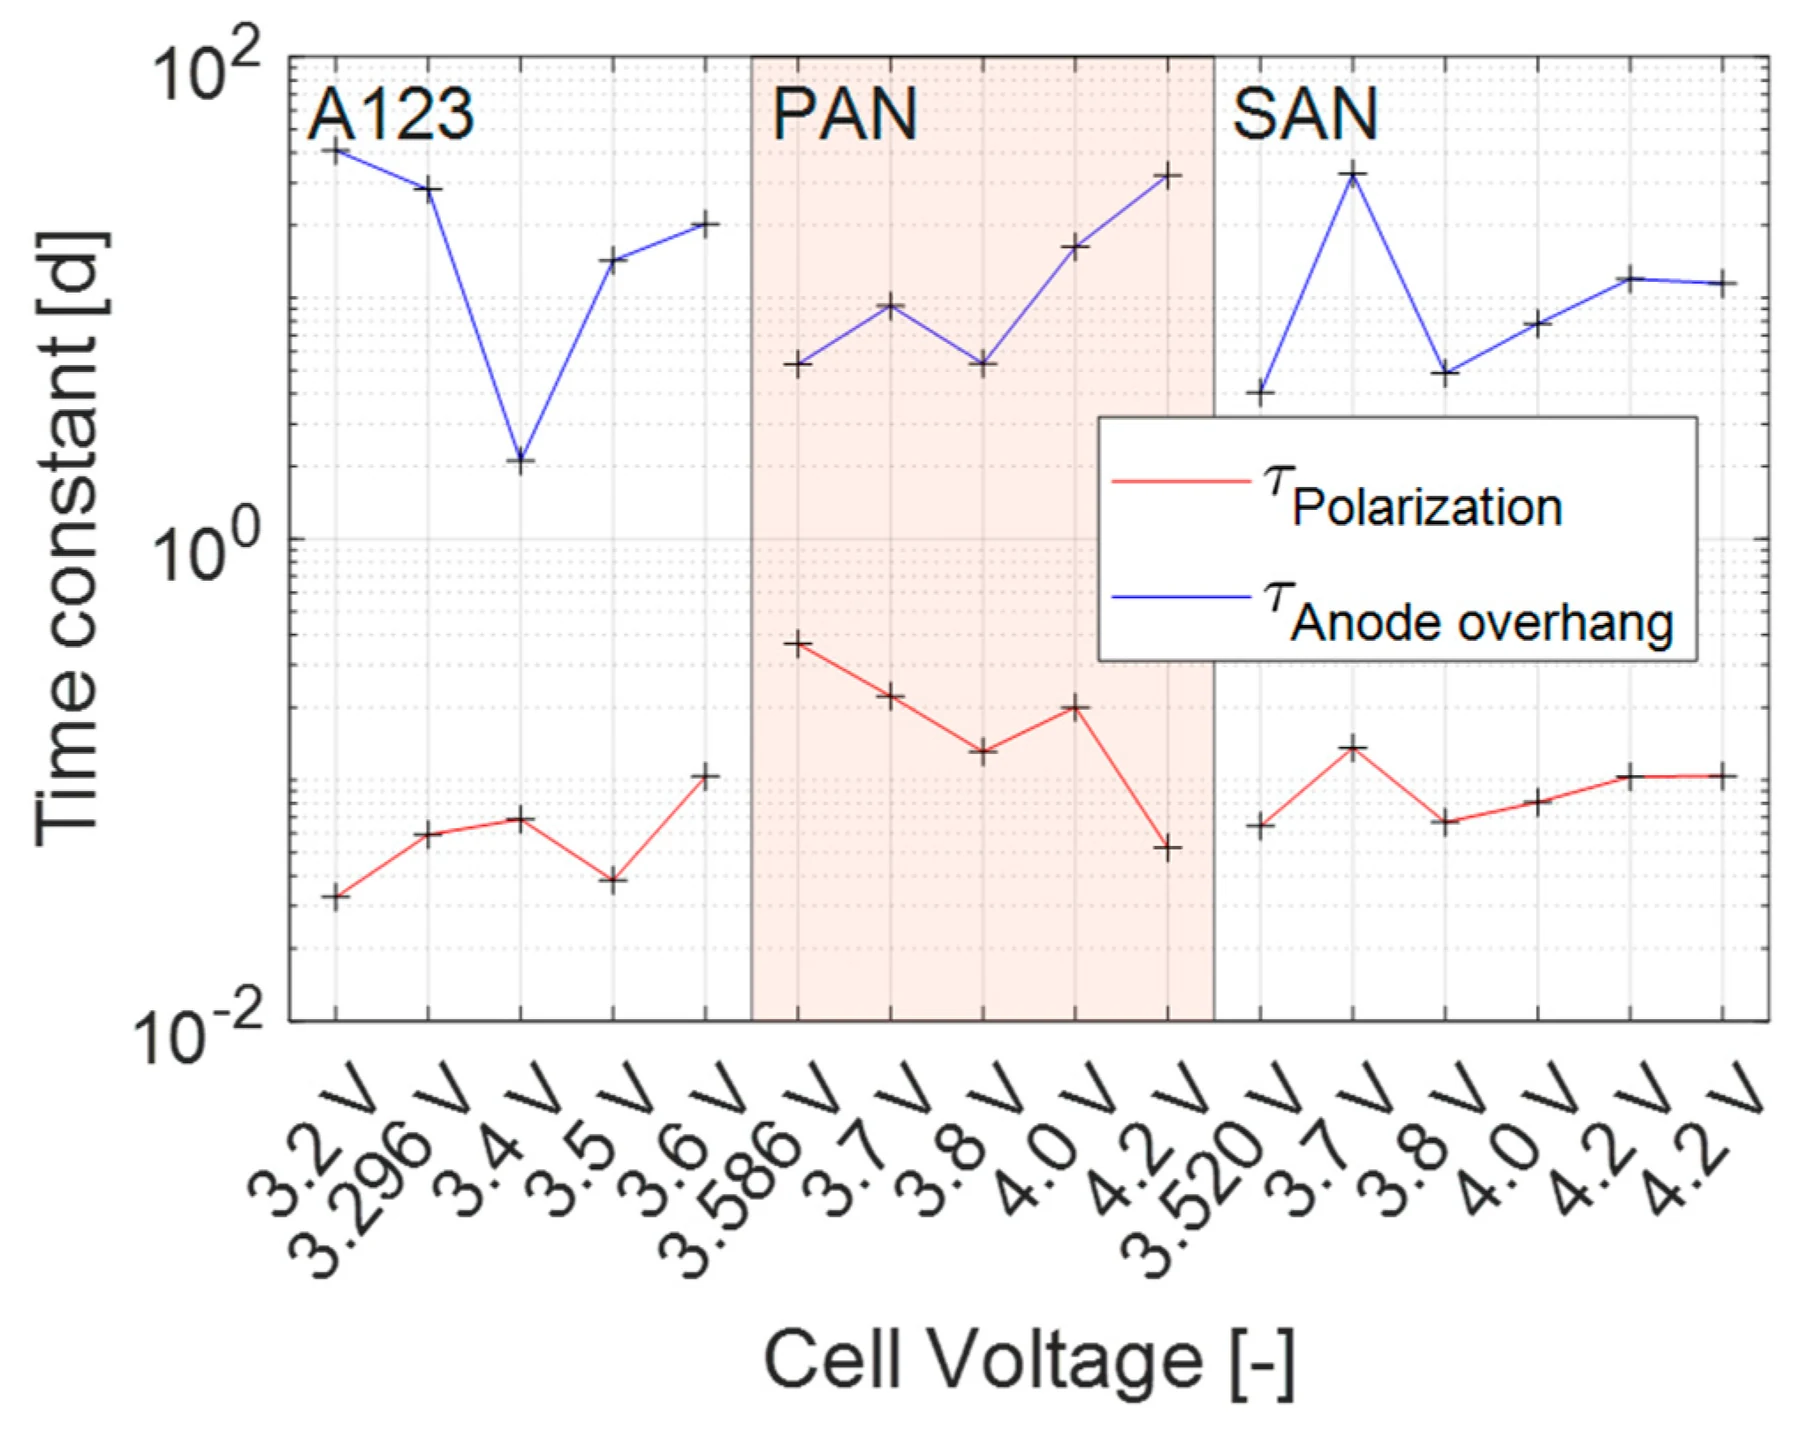
Figure 4. Polarization relaxation generally decays on an hourly time scale, while anode-overhang equilibration can continue for days to tens of days. Both processes are superimposed on the measured self-discharge signal.
Beyond voltage relaxation, the following factors can change OCV or amplify measurement error and should also be excluded:
Temperature drift: Both OCV and side-reaction rates vary with temperature. The actual cell temperature matters more than the chamber setpoint.
Inconsistent SOC and charge path: Even at the same end voltage, differences in constant-voltage duration, cutoff current, and prior history can leave cells in different states.
Different OCV-SOC slopes: The same capacity loss can produce different voltage changes across chemistries and SOC ranges.
Test-system leakage: Contaminated fixtures, degraded insulation, protection boards, and sensing lines can all create external current paths.
Measurement resolution and drift: When the target change is only a few millivolts or less, instrument stability, channel consistency, and calibration directly affect grading results.
K-value thresholds should therefore not be copied directly from another manufacturer, cell model, or laboratory. A more robust approach is to use validated normal samples to establish the statistical distribution for the specific product, process step, and test window, then set warning and retest limits according to the cost of false decisions.
A more reliable self-discharge screening workflow
For production and R&D, self-discharge screening can be organized as a tiered workflow:
Standardize pretreatment. Specify formation or cycling state, target SOC, charging method, constant-voltage cutoff current, and pre-test history.
Allow full thermal equilibration. Place cells in a stable environment, record actual cell temperature, and prevent systematic temperature differences among tray positions.
Wait for the dominant relaxation to decay. Use preliminary experiments to determine the minimum rest time for the cell model and avoid misclassifying early rapid relaxation as leakage.
Measure OCV at multiple time points. Use at least two valid points to calculate K-value; when possible, retain the full voltage trajectory to identify nonlinear or intermittent abnormalities.
Screen against the batch distribution. Evaluate absolute limits, deviation from batch peers, and repeatability together rather than rejecting a cell at a single cutoff.
Retest abnormal samples. Reconnect the cell, inspect fixtures and insulation, and repeat the test under identical conditions to rule out measurement-chain problems.
Confirm with a second method. Options include capacity loss, potentiostatic compensation current, ACIR/DCIR, temperature rise, thermal imaging, or more advanced nondestructive inspection.
Close the loop. Feed teardown or failure-analysis results back into the grading rules and continuously evaluate false-negative rate, false-positive rate, and test throughput.
Standards such as IEC 61960-3 provide a framework for performance testing and post-storage capacity evaluation of portable secondary lithium cells and batteries [6]. When developing an internal self-discharge SOP on this basis, companies should also validate instrument accuracy, fixture insulation, channel consistency, and measurement-system repeatability and reproducibility.
How to shorten the test without sacrificing reliability
A shorter test cannot be achieved simply by reading the second voltage point earlier. More effective measures include improving voltage and microcurrent stability, optimizing test SOC, applying temperature compensation, using multi-point trajectories to distinguish relaxation from sustained decay, and identifying abnormal patterns from historical batch data. For data-driven models, the training set must cover normal variation, multiple temperature ranges, different chemistries, and verified abnormal samples, and the workflow must retain a retest mechanism.
A practical fast-testing strategy usually uses two-stage screening. First, a low-cost, highly parallel OCV/K-value test identifies suspect cells. Compensation current, capacity loss, or a longer storage period then confirms the result. This reduces the inventory burden of storing every cell for an extended period while preventing an unvalidated rapid indicator from becoming the final safety decision.
Common misconceptions
Misconception 1: Any voltage drop is self-discharge. Voltage relaxation and temperature changes also alter OCV.
Misconception 2: An out-of-limit K-value proves a soft internal short. It shows only that voltage decay is abnormal under the specified test conditions; the cause still requires confirmation.
Misconception 3: One K-value limit applies to every cell. Limits cannot be transferred directly across chemistries, SOC ranges, capacities, or test windows.
Misconception 4: A longer rest always gives a more accurate result. More time can enlarge differences, but it also increases exposure to temperature drift, inventory cost, and aging. The test window should be established by validation.
Misconception 5: No visible temperature rise means no soft internal short. Early leakage power may be very small, and local heat can dissipate quickly. Electrical and thermal signals should be evaluated together.
Frequently asked questions
What is a battery self-discharge k-value?
K-value usually refers to the rate of OCV change over a specified rest interval, commonly reported in mV/day. It is useful for batch comparison, but it must be reported together with SOC, temperature, rest time, and measurement method.
Does a lower k-value always mean a better cell?
Under identical conditions, a low and stable K-value usually indicates slower voltage decay. It does not replace capacity, internal-resistance, cycle-life, or safety testing, and insufficient instrument resolution can also make the value appear artificially small.
Is OCV-decay screening alone suitable for LFP cells?
Extra caution is required. LFP cells have a relatively flat voltage plateau over a broad SOC range, so a small capacity loss may not produce an obvious voltage drop. Select an appropriate SOC window and consider confirmation with compensation-current or capacity-loss measurements.
How long should a cell rest before testing?
There is no fixed answer that applies to every cell. Preliminary testing should determine when voltage relaxation reaches a relatively stable stage. For newly formed cells, particular attention should be paid to the long-term effect of anode-overhang equilibration.
What should be done after abnormal self-discharge is detected?
First isolate the cell and retest it under identical conditions. Inspect fixtures, insulation, and external circuitry, then confirm the result with a second method. A sample that may pose a safety risk should not simply be recharged and returned to use; it should enter the company's defined failure-analysis and disposition process.
Conclusion
Batteries lose charge even while unused, but the apparent loss may reflect normal side reactions, voltage relaxation, measurement-system error, abnormal leakage, or a soft internal short. The value of self-discharge testing is not to replace every safety decision with one K-value. It is to identify a small number of abnormal cells as early as possible under consistent, stable, and traceable conditions.
For a test team, credibility depends on standardized SOC and charge history, sufficient thermal equilibration and rest, multi-point measurement, batch statistics, abnormal-sample retesting, and confirmation with a second method. When these steps form a closed loop, self-discharge data can move beyond simply waiting in storage to see whether voltage falls and become an evidence-based quality and safety screening tool with clearly defined limits.
References
[1] Roth, T., Streck, L., Graule, A., Niehoff, P. & Jossen, A. Relaxation effects in self-discharge measurements of lithium-ion batteries. Journal of The Electrochemical Society 170, 020502 (2023). https://doi.org/10.1149/1945-7111/acb669
[2] Deutschen, T., Gasser, S., Schaller, M. & Siehr, J. Modeling the self-discharge by voltage decay of a NMC/graphite lithium-ion cell. Journal of Energy Storage 19, 113-119 (2018). https://doi.org/10.1016/j.est.2018.07.003
[3] Schmidt, J. P., Weber, A. & Ivers-Tiffée, E. A novel and fast method of characterizing the self-discharge behavior of lithium-ion cells using a pulse-measurement technique. Journal of Power Sources 274, 1231-1238 (2015). https://doi.org/10.1016/j.jpowsour.2014.10.163
[4] Zhang, G. et al. Internal short circuit mechanisms, experimental approaches and detection methods of lithium-ion batteries for electric vehicles: A review. Renewable and Sustainable Energy Reviews 141, 110790 (2021). https://doi.org/10.1016/j.rser.2021.110790
[5] Maleki, H. & Howard, J. N. Internal short circuit in Li-ion cells. Journal of Power Sources 191, 568-574 (2009). https://doi.org/10.1016/j.jpowsour.2009.02.070