Separate the three terms first
dQ/dV or IC curve; the method is ICA: Incremental Capacity Analysis is post-processing applied to charge or discharge Q-V data, normally from a constant-current step. Its vertical axis is capacity per voltage, such as Ah/V or mAh/V. It is mainly used to examine full-cell reaction plateaus, consistency, aging, and state of health.
CV (cyclic voltammetry): Cyclic Voltammetry actively sweeps the working-electrode potential at a defined scan rate and records current. The result is a current-potential curve used to study redox potentials, reversibility, polarization, and kinetics.
CV (constant-voltage charging): Constant Voltage is a charging step. The tester holds the cell at the upper voltage limit while current decays toward a cutoff value. It is not a material-characterization method and has no methodological relationship to cyclic voltammetry.
The fastest way to identify the method is to inspect the controlled variable and the vertical axis. A potential sweep with current on the vertical axis indicates cyclic voltammetry. A fixed terminal voltage with current decaying over time indicates constant-voltage charging. A vertical axis in Ah/V or mAh/V indicates dQ/dV.
Where the dQ/dV equation comes from
The charge passed through a cell up to time t is Q(t) = ∫I(t)dt, so dQ/dt = I. If voltage changes monotonically with time, the chain rule allows time to be replaced by voltage:
dQ/dV = (dQ/dt) / (dV/dt) = I / (dV/dt)
Standard ICA normally uses low-rate constant-current data. With I approximately constant, differences in the curve are driven mainly by dV/dt. When voltage changes slowly through a reaction region while capacity continues to accumulate, the denominator becomes small and a dQ/dV peak appears. The unit, Ah/V or mAh/V, means capacity accumulated per unit voltage; it is not a reaction-rate unit. The chain rule itself does not require constant current, but constant current, monotonic voltage, and consistent temperature make tests comparable [1].
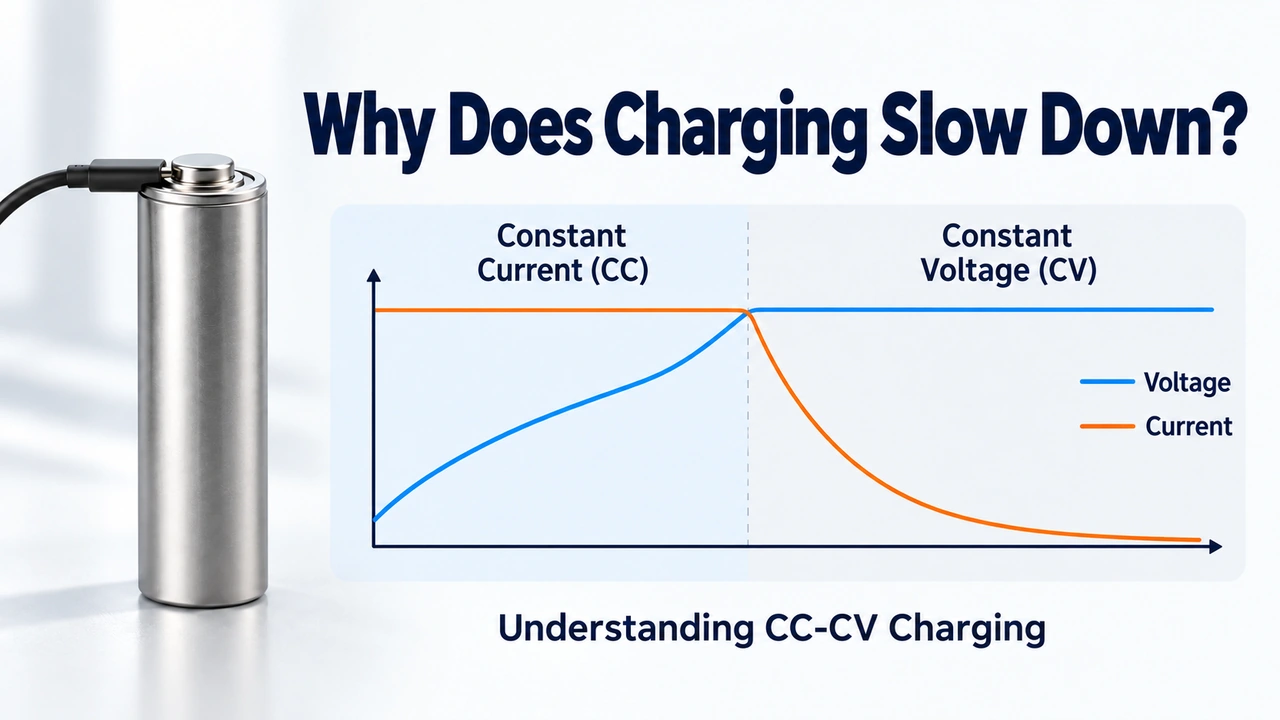
This equation also explains why the constant-voltage portion of CC-CV charging is unsuitable for standard ICA. During the CV step, dV/dt approaches zero and the same voltage corresponds to continuously increasing capacity. dQ/dV therefore becomes singular or loses its single-valued meaning. The fundamental problem is not merely that current changes; voltage is no longer an independent coordinate that traverses the reaction process.
What peak position, height, area, and sign mean
Peak voltage reflects a reaction feature at the cell terminals, but terminal voltage is not a pure equilibrium potential. During charge, it can be viewed approximately as Vterminal = OCV + IR + ηcharge-transfer + ηconcentration; the polarization terms reverse direction during discharge. Higher rate, lower temperature, or greater resistance generally moves charge peaks to higher voltage and discharge peaks to lower voltage, while broadening the peaks. Peak height and area also depend on active material, plateau slope, polarization, sampling, and filtering. Local peak area is most useful only when the peak is well separated and returns close to baseline [1].
The sign of dQ/dV depends on the capacity convention. If charge capacity accumulates positively while voltage rises, the charge curve is normally positive. If discharge capacity accumulates positively while voltage falls, dQ/dV is normally negative. Some software plots -dQ/dV, uses the absolute value, or makes discharge capacity decrease from full capacity toward zero. A positive peak is therefore not automatically a cathode peak, and a negative peak is not automatically an anode peak. The charge/discharge direction, sign convention, and electrode configuration must be stated first.
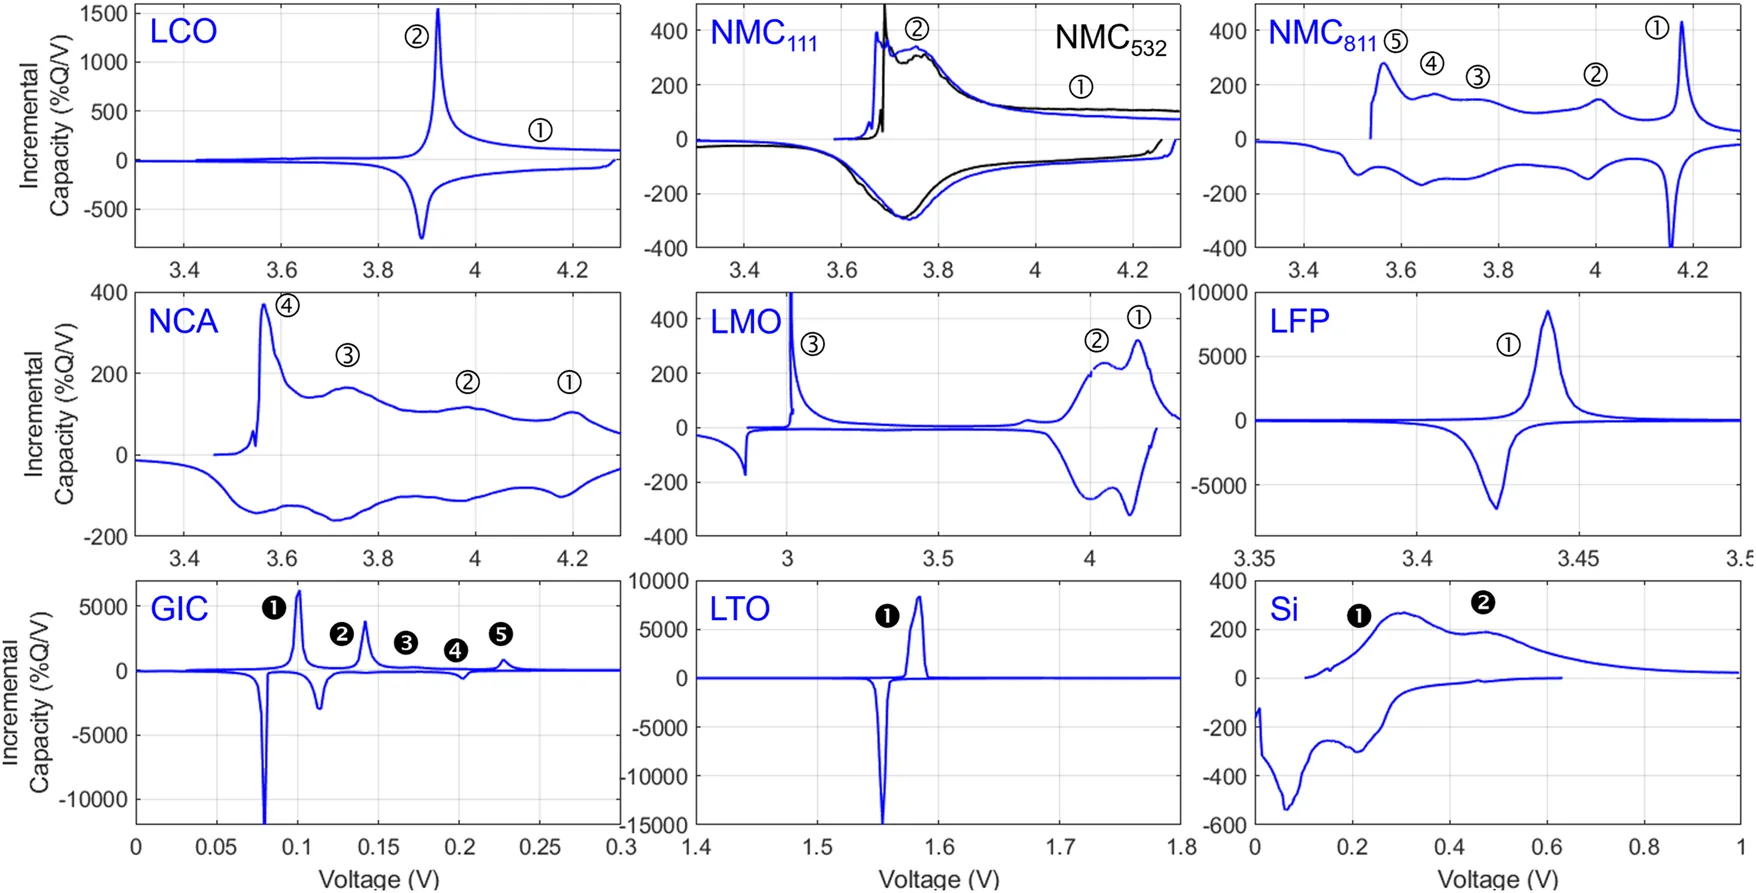
Figure 1. Half-cell incremental-capacity signatures of common positive- and negative-electrode materials. Positive and negative branches must be read with the charge/discharge direction and capacity sign convention; they cannot be transferred directly to a commercial full cell.
Half-cell and full-cell peaks are not interchangeable
A half-cell reports the potential of one working electrode relative to Li/Li+, whereas full-cell voltage is the difference between the positive- and negative-electrode potentials: Vcell = Vpositive - Vnegative. A full-cell dQ/dV peak may be formed by a positive-electrode plateau, a negative-electrode plateau, or the capacity matching of both. Figure 1 is useful for learning material fingerprints, but assigning a commercial-cell peak to one electrode normally requires half-cell reference curves, three-electrode data, or an electrode-matching model [1,3,7].
Even cells described as NMC/graphite can show different peaks when N/P ratio, SOC window, cathode formulation, or silicon content changes. Engineering diagnosis should begin with a fresh baseline for the exact cell model under standardized conditions. A peak table from another product should not be used as a direct failure verdict.
A reliable dQ/dV workflow
Standardize the test: Fix temperature, rate, SOC window, rest time, and cutoff criteria. Prefer a low-rate reference test. Check for temperature differences, insufficient rest, and changing contact resistance.
Segment the data: Separate charge and discharge and retain only constant-current data with a consistent direction. Remove rest periods, pulses, step transitions, and the constant-voltage segment.
Check data quality: Inspect voltage/current timestamps, missing points, duplicate voltages, and jumps. Repeated voltage values can make ΔV approach zero, while current offset accumulates into capacity error.
Use a fixed voltage grid: Interpolate Q-V data onto the same ΔV grid for every cycle. A 2 mV grid is a practical starting point; curves generated on different grids should not be compared directly.
Differentiate and filter: Calculate ΔQ/ΔV and smooth only when necessary. Preserve the untreated curve. An excessive window can suppress, shift, or merge adjacent peaks.
6. Extract and validate features: Track peak voltage, height, valleys, local area, and peak separation, then verify them with repeat tests. Selecting only the most attractive peak creates selection bias.
Dubarry and Anseán recommend a low-rate constant-current reference test, typically C/25; voltage sampling at 1-2 mV or roughly 2,000 points per charge/discharge step; and resampling to a fixed interval of about 2 mV before smoothing is considered [1]. If production timing requires a faster reference condition such as C/10, build a separate internal baseline and do not mix it with C/25 results.
Why differentiation amplifies noise
Discrete data are evaluated as ΔQ/ΔV. If neighboring voltage points should differ by 2 mV but noise changes that difference to 1 or 3 mV, the denominator error passes directly into the result. The smaller ΔV becomes, the more strongly a small voltage fluctuation is amplified. Differentiation acts like a magnifying glass that reveals weak plateaus and high-frequency noise at the same time.
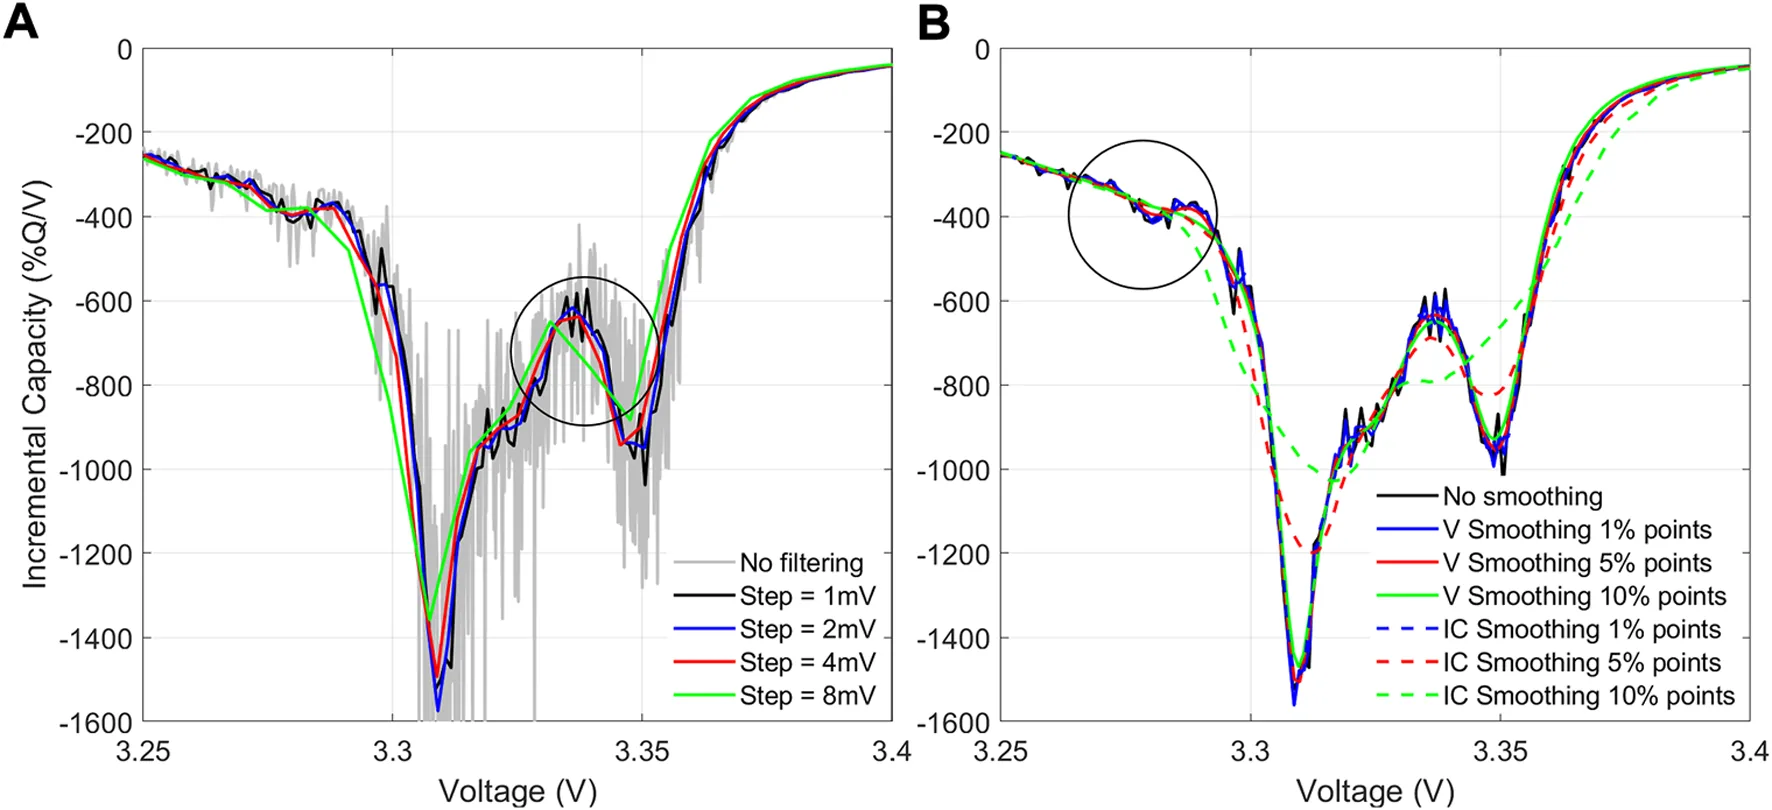
Figure 2. Voltage step, filtering, and smoothing can substantially change dQ/dV peak shape. The left panel compares voltage steps; the right panel compares smoothing levels. Processing parameters must be fixed and validated.
No smoothing-window length is universal across chemistries. On a 2 mV grid, 5-11 points can be used as an initial trial range, corresponding to 10-22 mV, but only when that span is clearly smaller than the narrowest valid feature. For engineering acceptance, repeat the same cell independently at least three times and estimate the standard deviation of peak voltage and area. A project-level peak-position alert can be set to the larger of two voltage bins or 3σ repeatability; peak height and area can use their own 3σ limits. Without a repeatability baseline, ±4 mV on a 2 mV grid is only a temporary screening rule, not an industry-wide standard.
Aging diagnosis requires a pattern, not a single-peak verdict
Several peaks shift relative to one another and the usable-capacity window moves: A possible explanation is loss of lithium inventory (LLI), which offsets the stoichiometric windows of the two electrodes. Confirm with half-cell matching, OCV fitting, coulombic efficiency, and capacity loss.
A peak or local area associated with one electrode continuously weakens: This may indicate loss of positive- or negative-electrode active material (LAMPE/LAMNE). Confirm with electrode matching, DVA, teardown, or a three-electrode cell after excluding peak overlap and voltage-window truncation.
Charge peaks move higher, discharge peaks move lower, and peaks broaden: This pattern can indicate increased ohmic resistance or kinetic limitation. Confirm with DCIR or EIS and compare peak separation across rate and temperature.
A new plateau or derivative feature appears during discharge or rest after low-temperature or fast charging: Reversible lithium plating and stripping are possible explanations. Confirm with voltage relaxation, DVA/ICA, three-electrode measurements, thermal evidence, or teardown. The absence of a feature does not exclude irreversible plating.
LLI, LAMPE, LAMNE, and resistance growth are coupled, so the same peak change can arise from several combinations. A practical workflow builds a degradation map for the cell chemistry and follows multiple features continuously. Reversible plated lithium can leave a stripping-related platform or derivative feature during subsequent discharge or relaxation, but irreversible plated lithium may rapidly become dead lithium or reaction products. No new peak does not prove that plating did not occur [1,7].
Using dQ/dV features in an SOH model
A reproducible feature set can include peak voltage Vpk, peak height Hpk, local area Apk bounded by neighboring valleys, charge/discharge peak separation ΔVpk, and their changes from a fresh baseline. For example, Apk = ∫V1 to V2 (dQ/dV)dV is comparable only when V1 and V2 are defined by the same rule in every cycle. Training and test sets should be split by cell, not by randomly assigning cycles from the same cell to both sets, which would produce overly optimistic SOH accuracy.
More features are not automatically better. Use repeatability and correlation screening to remove unstable features, then cross-check the remaining features against capacity, DCIR, EIS, or other independent measurements. For chemistries with strongly overlapping peaks, fixed-window area, curve-segment correlation, or a full-curve model may be more robust than forced single-peak tracking.
DVA complements dQ/dV
Differential Voltage Analysis (DVA) plots dV/dQ against Q. dQ/dV emphasizes how capacity is concentrated in a voltage interval and is convenient for reaction plateaus. dV/dQ emphasizes voltage change per unit capacity and is useful for electrode-potential matching, plateau boundaries, and electrode capacity windows. In a local region where the derivative is nonzero and the data are smooth, the two derivatives are approximately reciprocal. Their peaks and valleys are not mechanically interchangeable when noise, flat plateaus, overlap, or sign conventions are involved [3,4].
In industrial diagnosis, ICA and DVA are often paired: dQ/dV quickly exposes peak position, width, and area changes, while dV/dQ supports electrode matching with half-cell reference curves. DVA can be more direct for negative-electrode active-material loss or electrode-capacity balance, whereas dQ/dV is convenient for online tracking in the terminal-voltage domain [1,3].
CV (cyclic voltammetry) measures current response
Cyclic voltammetry sweeps the working-electrode potential from a starting potential to a vertex potential and back at a defined scan rate v while recording current i. Oxidation and reduction peaks indicate strong Faradaic reactions in the corresponding potential regions. Peak separation, peak shape, and the relationship between forward and reverse peaks can help evaluate reversibility and polarization, but the results also depend on scan rate, active-material loading, electrode area, solution resistance, diffusion, and interfacial kinetics [5,6].
Figure 3 uses an original lithium/graphite half-cell figure rather than a platinum electrode in aqueous electrolyte. The current peaks change with scan rate, and the authors use the slope of log|i| versus log v to estimate the b value. For an ideal reversible system controlled by semi-infinite diffusion, peak current is proportional to √v. Porous insertion electrodes are often described empirically by i = a·v^b: b near 0.5 suggests a stronger diffusion contribution, b near 1 suggests a stronger surface or capacitive contribution, and intermediate values indicate mixed control. This criterion must be interpreted together with IR drop, peak overlap, and electrode architecture [6].
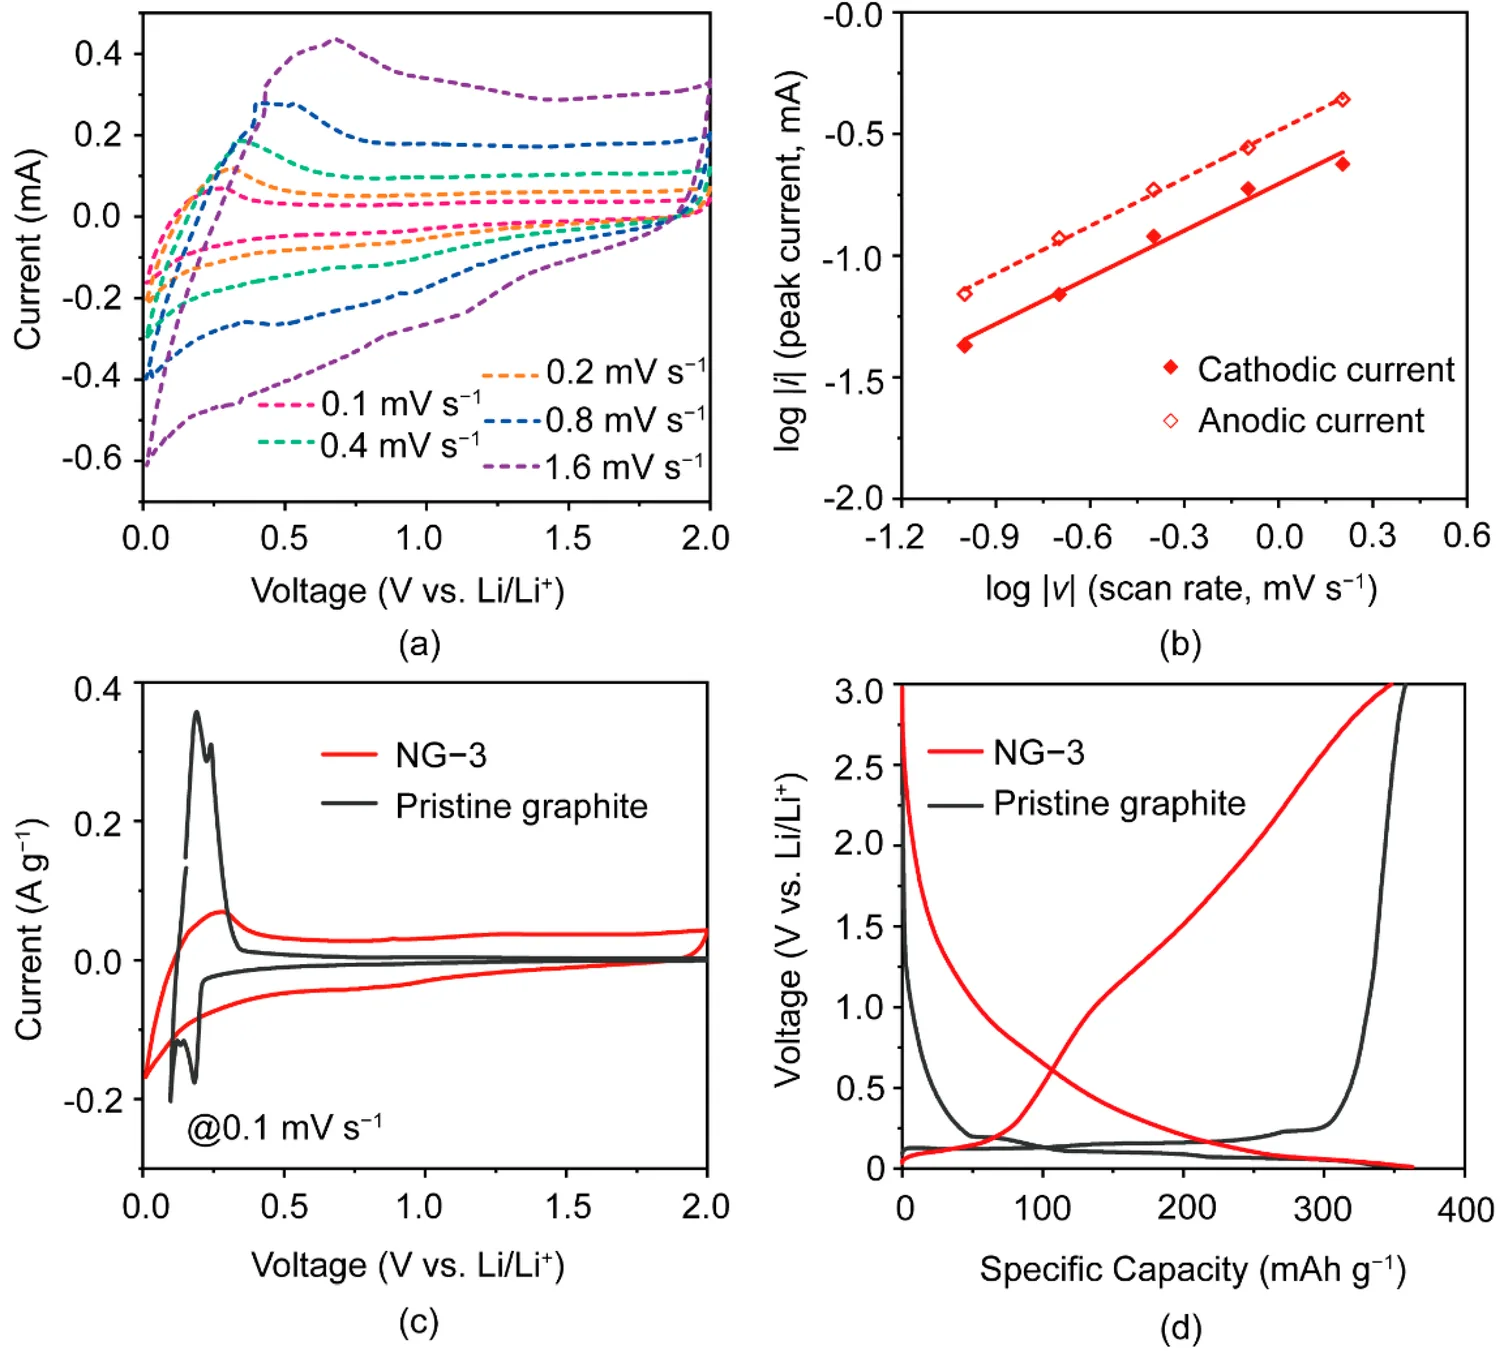
Figure 3. Original cyclic-voltammetry and kinetic-analysis figure for a lithium/nanographite half-cell. It includes multiple scan rates, b-value fitting, material comparison, and galvanostatic voltage curves, showing that CV peak current depends on scan rate.
Three-electrode, half-cell, and commercial two-electrode boundaries
Laboratory material CV typically uses a three-electrode arrangement: the working electrode carries the material under test, the reference electrode provides a stable potential reference, and the counter electrode closes the current path. A lithium-metal coin half-cell often uses lithium as both reference and counter electrode, so it is not an ideal independent three-electrode system. A commercial full cell is a two-electrode system whose terminal voltage includes both electrode potentials and full-cell polarization. A half-cell CV reaction potential therefore cannot be treated as directly equal to a commercial full-cell terminal-voltage peak [5,6].
Core differences between dQ/dV and cyclic voltammetry
Method type: dQ/dV or ICA is post-processing of constant-current charge/discharge data. Cyclic voltammetry is an active potential-sweep experiment.
Control and measurement: ICA normally controls current and records capacity Q and terminal voltage V. Cyclic voltammetry controls working-electrode potential E and records instantaneous current i.
Vertical axis and units: dQ/dV uses Ah/V or mAh/V. Cyclic voltammetry uses current or normalized current, such as A, A/g, or A/cm².
Meaning of a peak: A dQ/dV peak indicates capacity concentrated in a voltage interval and reflects plateau or phase-transition behavior. A CV peak indicates enhanced oxidation or reduction current at a potential and carries strong kinetic information.
Best-suited object: dQ/dV is suited to full-cell consistency, aging, SOH, and degradation modes. Cyclic voltammetry is suited to materials, electrodes, electrolyte reactions, and interface studies.
Main limitation: dQ/dV depends on stable current, temperature, and sampling and does not directly capture instantaneous kinetics. Cyclic voltammetry does not directly reproduce the multilayer polarization of a commercial large-format cell and strongly depends on electrode and scan conditions.
The peaks cannot be mapped one-to-one because the experiments, observables, and units are different. CV records instantaneous current at a potential and is strongly weighted by kinetics. dQ/dV records the derivative of accumulated capacity as the cell passes through a voltage interval and is closer to the thermodynamic and capacity-distribution information of a low-rate voltage plateau. They can support one another only when the conditions, reaction system, and model assumptions are clearly defined.
CV in CC-CV means constant-voltage charging
In CC-CV charging, the cell first charges at constant current to the upper voltage limit, then switches to constant voltage and waits for current to decay to the cutoff value. The current decline reflects several coupled factors: the equilibrium potential approaches the upper limit as SOC rises, charge-transfer overpotential changes, solid-state and electrolyte concentration gradients develop, and ohmic and interfacial resistance limit current. This is not cyclic voltammetry and it does not sweep potential forward and backward.
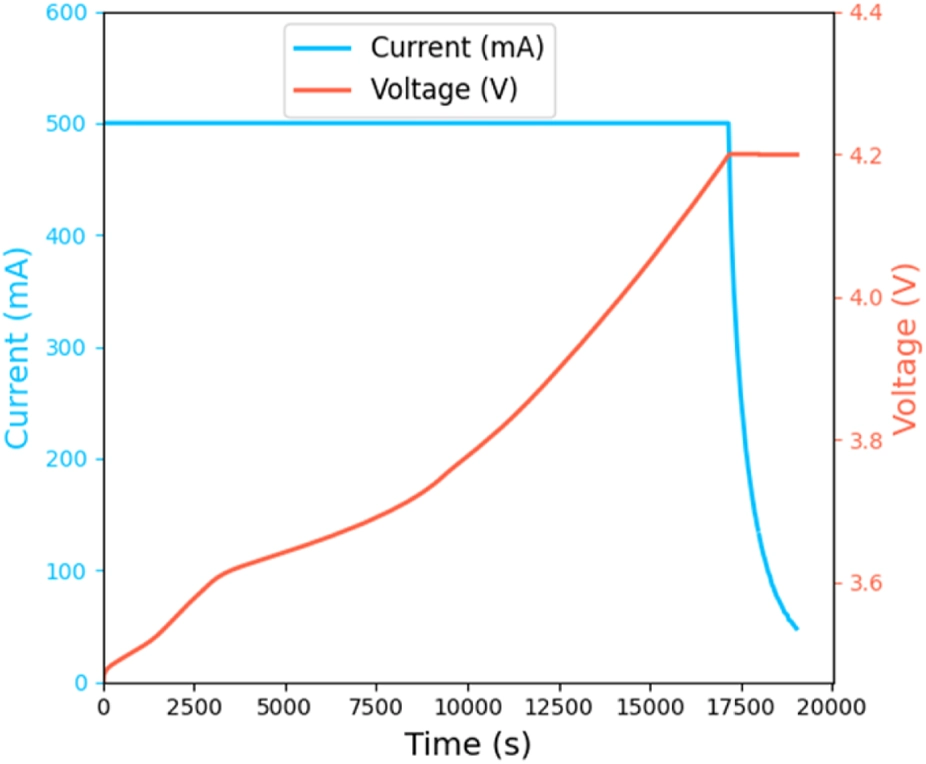
Figure 4. Typical CC-CV charging profile. The transition occurs when the upper voltage limit is reached and control changes from constant current to constant voltage. The SOC at this point depends on rate, temperature, aging, and cell design; it is not a universal fixed value.
For ICA, remove the constant-voltage segment at the step level instead of appending CV capacity to constant-current dQ/dV. The CV segment can still be analyzed separately through CV duration, cutoff current, CV-capacity fraction, and current-decay features. These quantities are valuable for resistance, fast-charge acceptance, and aging, but they are charging-process features rather than standard incremental-capacity peaks.
Choosing the method by engineering task
Screening a new cathode or anode material: Use cyclic voltammetry plus galvanostatic half-cell testing. Report reference electrode, scan rate, loading, area, and potential window.
Cycling-aging analysis of an NMC/graphite full cell: Use low-rate dQ/dV together with DVA. Standardize temperature and SOC window and combine the result with capacity, DCIR/EIS, and half-cell baselines.
Production-batch consistency: Use standardized constant-current dQ/dV. Fix the voltage grid and filter settings and establish repeatability-based 3σ control limits first.
Fast-charge lithium-plating risk: Use discharge or relaxation ICA/DVA after charging and combine it with temperature, current, three-electrode measurements, or other independent evidence. Do not assign plating from one peak alone.
CC-CV charging-strategy optimization: Use time-domain current, voltage, temperature, CV duration, and CV-capacity analysis. Apply ICA only to stable constant-current segments.
Material-reaction kinetics: Use CV at multiple scan rates and examine i-√v behavior or b values together with IR drop, peak separation, and cycle stability.
Key takeaways
When you see CV, check the full English term. Cyclic Voltammetry and Constant Voltage are unrelated methods.
Check the vertical axis. A or A/g normally indicates cyclic voltammetry; Ah/V indicates dQ/dV; current decay at a fixed upper voltage indicates constant-voltage charging.
A dQ/dV peak means capacity is concentrated on the voltage axis, not that the reaction is faster. IR drop, charge transfer, and concentration polarization can shift the peak.
The sign of dQ/dV depends on capacity definition, and half-cell peaks cannot be transferred directly to a full cell.
Reliable ICA requires low rate, stable temperature, a fixed voltage grid, removal of rest and CV segments, and project-specific limits based on repeat tests.
Aging diagnosis should combine peak position, width, area, separation, DVA, capacity, and resistance evidence. One peak cannot uniquely prove LLI, LAM, or lithium plating.
References
[1] Dubarry, M.; Anseán, D. Best Practices for Incremental Capacity Analysis. Frontiers in Energy Research 10, 1023555 (2022). https://doi.org/10.3389/fenrg.2022.1023555
[2] Dubarry, M.; Anseán, D. Corrigendum: Best Practices for Incremental Capacity Analysis. Frontiers in Energy Research 11, 1203569 (2023). https://doi.org/10.3389/fenrg.2023.1203569
[3] Bloom, I. et al. Differential Voltage Analyses of High-Power, Lithium-Ion Cells: 1. Technique and Application. Journal of Power Sources 139, 295-303 (2005). https://doi.org/10.1016/j.jpowsour.2004.07.021
[4] Bloom, I. et al. Differential Voltage Analyses of High-Power Lithium-Ion Cells: 2. Applications. Journal of Power Sources 139, 304-313 (2005). https://doi.org/10.1016/j.jpowsour.2004.07.022
[5] Elgrishi, N. et al. A Practical Beginner’s Guide to Cyclic Voltammetry. Journal of Chemical Education 95, 197-206 (2018). https://doi.org/10.1021/acs.jchemed.7b00361
[6] Bard, A. J.; Faulkner, L. R.; White, H. S. Electrochemical Methods: Fundamentals and Applications, 3rd ed. Wiley (2022).
[7] Birkl, C. R.; Roberts, M. R.; McTurk, E.; Bruce, P. G.; Howey, D. A. Degradation Diagnostics for Lithium Ion Cells. Journal of Power Sources 341, 373-386 (2017). https://doi.org/10.1016/j.jpowsour.2016.12.011