Liquid cells rely on wetting; solid-state cells rely on controlled contact
In a conventional lithium-ion battery, the liquid electrolyte infiltrates the pores of both electrodes and wets the surfaces of the active material, conductive additive, and separator. Even when an electrode is rough, the liquid can fill part of the micropore network, so ion transport does not depend entirely on direct solid-to-solid contact. An all-solid-state battery contains several solid phases instead. At the microscopic scale, active-material and solid-electrolyte particles initially touch at a limited number of asperities. The nominal geometric area is therefore not the same as the real electrochemically active contact area.
When normal pressure is applied, particles rearrange, softer phases deform elastically, plastically, or viscoplastically, porosity falls, and the real contact area increases. Continuous ion pathways across the interface can then develop. This mechanism explains why impedance often decreases when a solid-state cell is compressed. It also sets an important interpretation boundary: pressure primarily improves contact and structure; it should not be described loosely as a sudden increase in the intrinsic ionic conductivity of the solid electrolyte.[1]
Separate three pressures: fabrication, assembly, and operating stack pressure
The word pressure often refers to different steps in solid-state battery papers and laboratory records. Fabrication or pelletizing pressure densifies a solid-electrolyte pellet, composite positive electrode, or multilayer stack and strongly affects initial porosity, particle connectivity, and mechanical integrity. Assembly pressure establishes the initial contact when the cell is sealed or the fixture is tightened. Operating stack pressure is the pressure maintained through the thickness direction during charge and discharge. These pressures differ in magnitude, duration, and purpose and should never be collapsed into a single statement that pressure was applied.[1]
Pressure should be calculated as load divided by the effective loaded area: p = F/A. If the force sensor reports F in newtons and the effective cell area A is recorded in square millimeters, pressure can be calculated directly as p (MPa) = F (N)/A (mm²), because 1 N/mm² equals 1 MPa. For a circular mold, report the piston or specimen diameter. For a pouch cell, state whether the denominator is electrode area, package area, or the effective pressure-plate area. Different area definitions produce different MPa values from the same load.
The force-transfer path must also be documented. Pressure-plate parallelism, piston friction, seal resistance, thread preload, sensor location, and fixture thermal expansion can all make a sensor reading differ from the actual interfacial stress. This is especially important in small-diameter laboratory molds: an eccentric load can produce the same average pressure but a completely different local pressure distribution.
A pressure window is essential because higher is not always better
The lower limit of the stack-pressure window is determined by whether continuous contact can be maintained. At insufficient pressure, vacancies left by lithium stripping cannot be compensated quickly enough by lithium creep or interfacial rearrangement, and voids begin to connect. Volume changes of active particles in a composite positive electrode can also cause debonding. Once the effective area shrinks, the same total current passes through fewer contact points. Local current density, polarization, and heat generation then rise, creating positive feedback among contact loss, current focusing, and accelerated damage.[2]
The upper limit is governed by material yielding, fracture, and lithium-penetration risk. Higher pressure can tighten an interface, but it may also drive lithium metal to creep along defects, pores, or grain boundaries, increasing the risk of solid-electrolyte crack growth and short circuit. Brittle oxide electrolytes, sulfide pellets, and Ni-rich positive-electrode particles do not share the same mechanical tolerance. Li/LLZO studies show that low pressure can cause persistent contact loss, while higher pressure improves conformity without eliminating lithium microstructure growth indefinitely. Excessive pressure may coexist with cracking and short circuiting.[2]
Every reported optimum must therefore include its boundary conditions: solid-electrolyte chemistry and thickness, positive- and negative-electrode chemistry, areal capacity, lithium-foil thickness, temperature, current density, cutoff conditions, and fixture boundary. Recent studies have demonstrated operation at 1-2.5 MPa with specific interface designs, formulations, and test conditions. These results show that interface engineering can reduce the pressure requirement; they do not establish a universal pressure for every all-solid-state battery.[3]
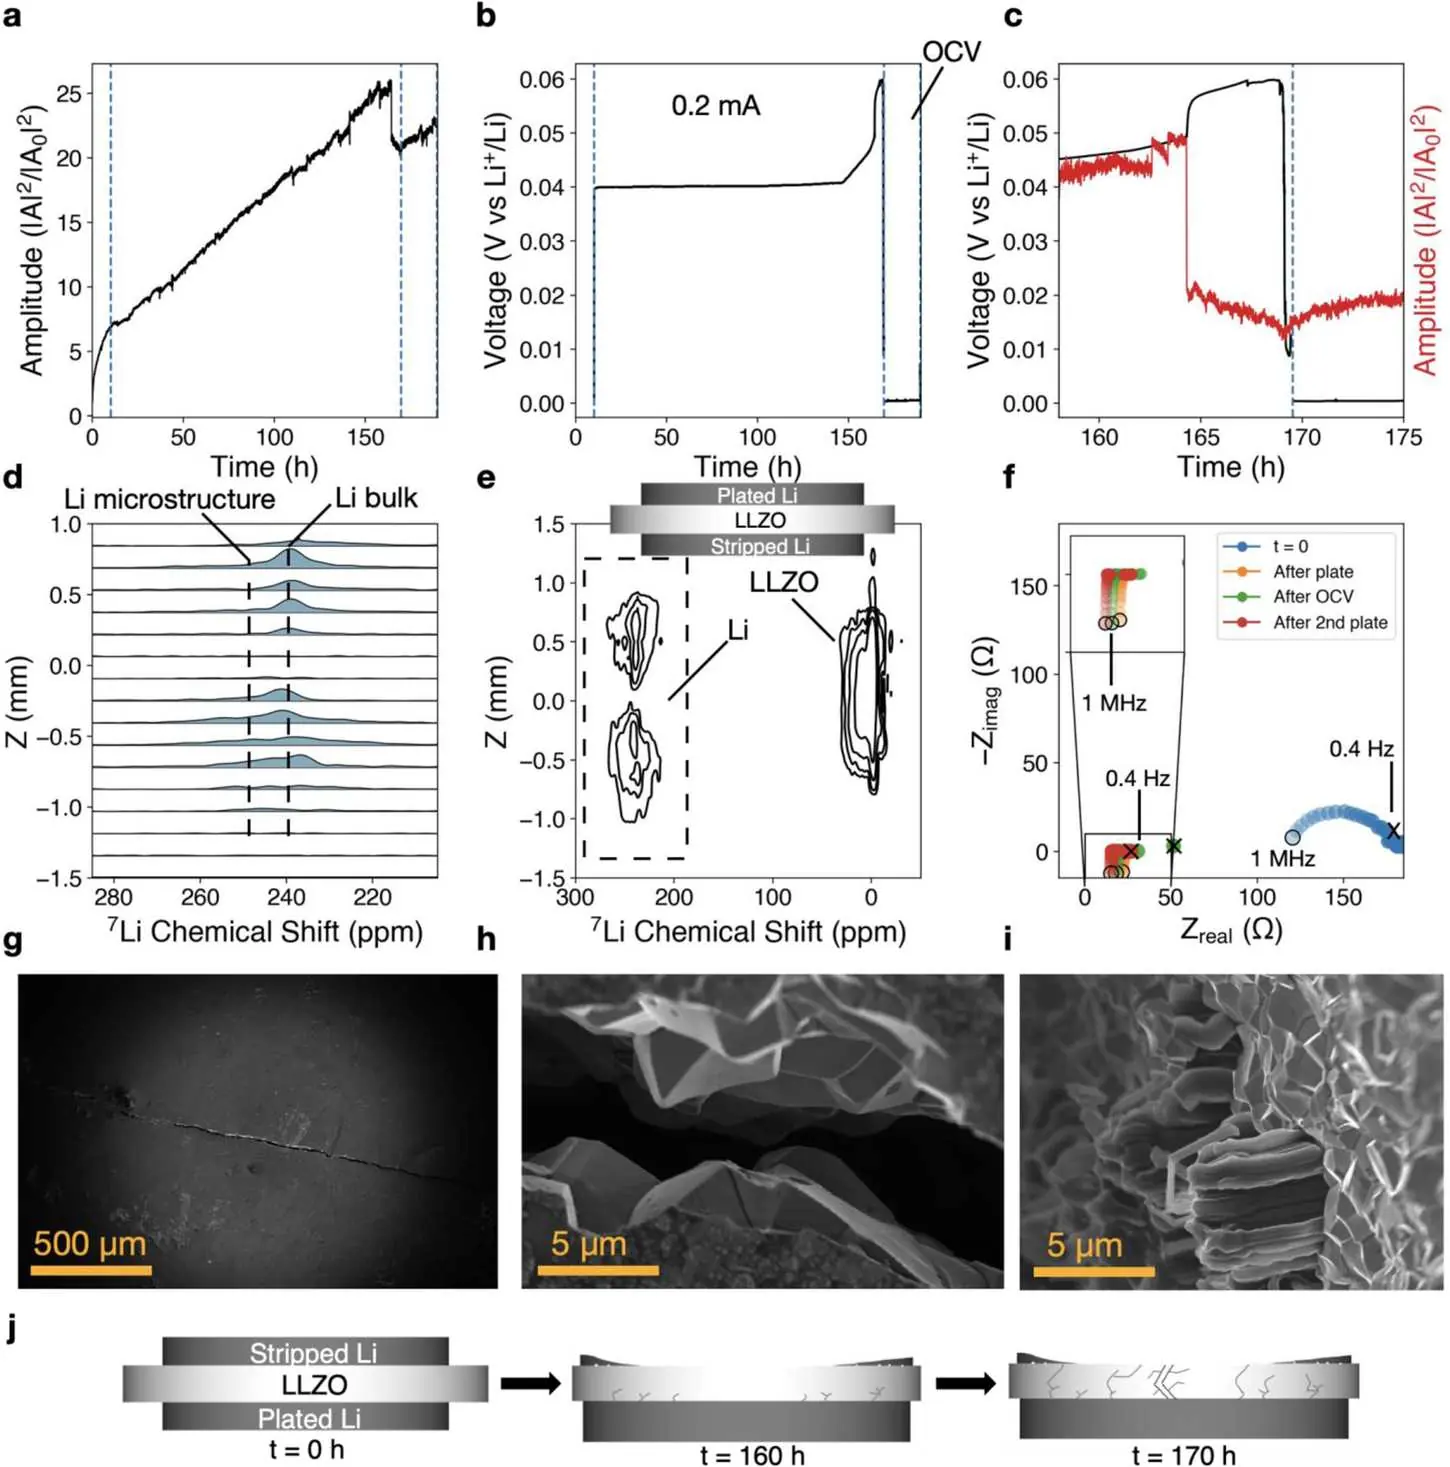
Figure 1. In this Li/LLZO/Li symmetric-cell experiment, 13 MPa improved initial contact, but prolonged polarization was still followed by lithium penetration, LLZO fracture, and electrochemical shorting. The result is specific to the materials, 0.2 mA cm⁻² current density, and other test boundaries reported in the source paper.
Constant pressure and constant displacement impose different mechanical boundaries
Laboratory fixtures commonly impose one of two boundary conditions. A constant-pressure system uses a pneumatic cylinder, hydraulic actuator, or closed-loop stage to compensate for changes in cell thickness and keep the load as stable as possible. It is suitable for studying electrochemical behavior at a specified pressure, although actuator displacement and control response should also be recorded. A constant-displacement system fixes the gap: cell expansion becomes a pressure increase, while contraction or interfacial relaxation produces a pressure decrease. This condition is closer to a rigid enclosure or fixed-gap cell. A screw fixture without a compliant element and real-time force sensing is not automatically a constant-pressure system.
Spring or disc-spring fixtures lie between these limits. By increasing system compliance, they convert thickness changes into smaller pressure fluctuations. The selected mode is part of the experimental hypothesis, not merely an equipment preference. Before comparing data, confirm fixture stiffness, spring constant, initial displacement, control mode, and pressure sampling rate. Otherwise, two cells with the same initial pressure may occupy very different mechanical states after tens of cycles.[3] The open-access study by Chang et al. provides both a fixed-pressure acoustic fixture and a fixed-gap synchronized acoustic-solid-state NMR fixture, illustrating how directly the mechanical boundary enters the experiment design.[2]
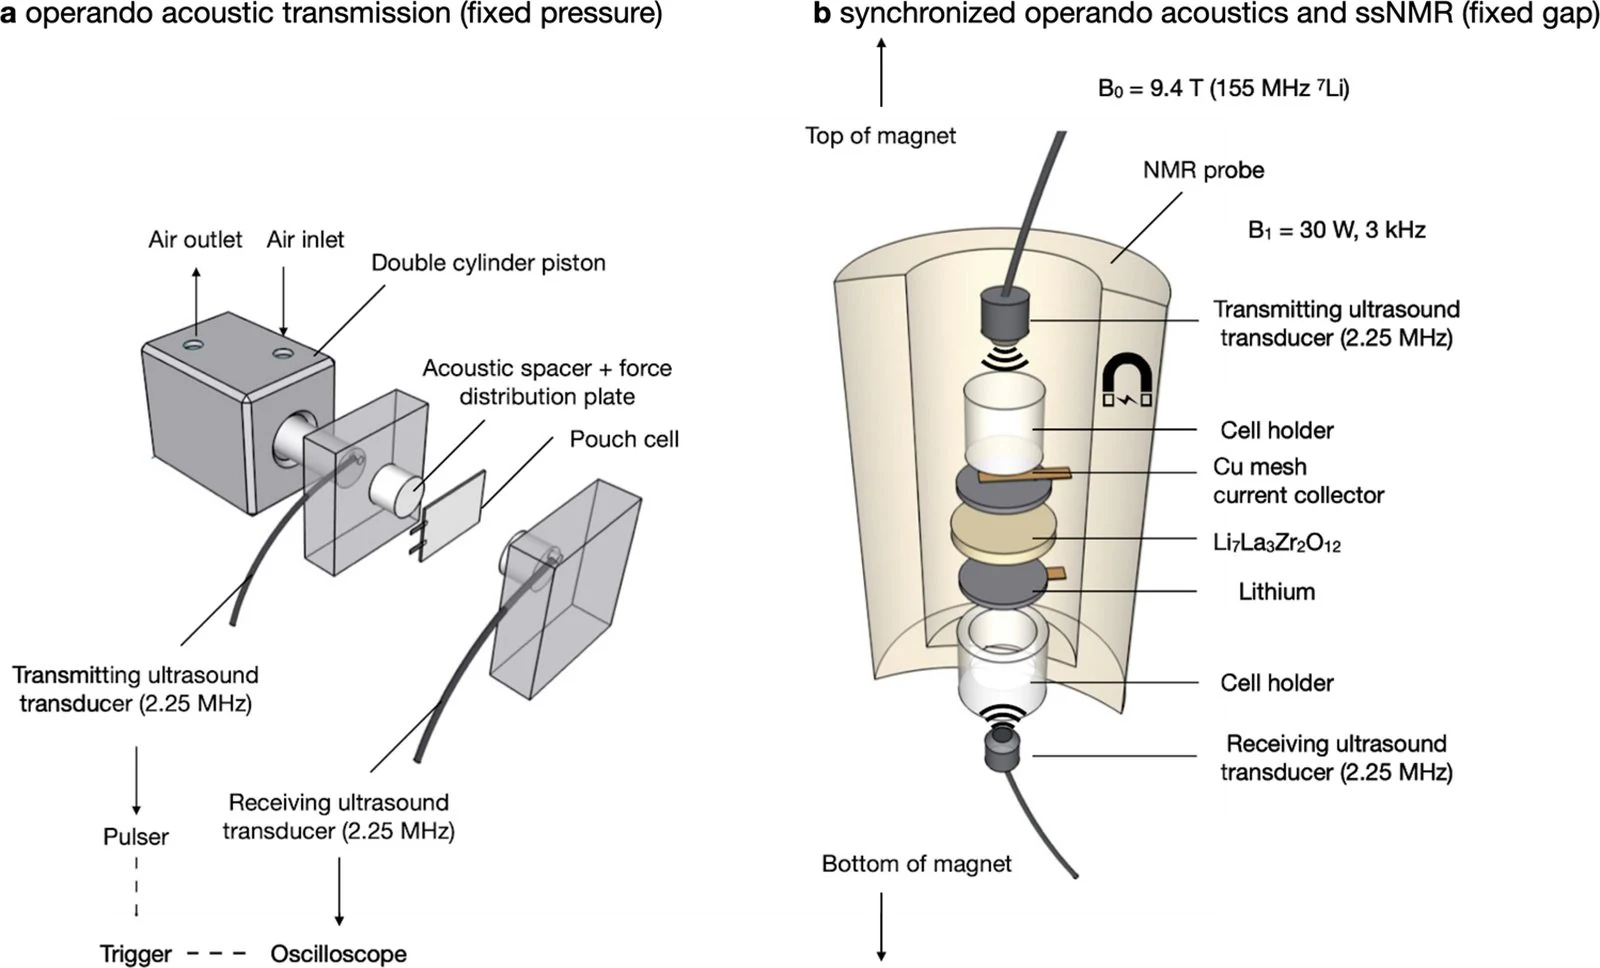
Figure 2. Two operando configurations reported in the literature: the left fixture uses a double-piston pneumatic cylinder to maintain fixed pressure while monitoring acoustic response; the right fixture uses a fixed gap to synchronize acoustic and solid-state NMR measurements.
How pressure appears in impedance, polarization, and cycle life
Changes in contact area first appear in the ohmic drop, interfacial impedance, and voltage polarization. A lower impedance after compression does not necessarily mean that every interfacial reaction has accelerated; the change may simply reflect more contact points and a more uniform local current distribution. Conversely, impedance growth after cycling should not be assigned immediately to a thicker reaction interphase. Pores, debonding, lithium voids, and loss of fixture pressure can produce similar signatures.
A more reliable diagnosis aligns voltage, current, capacity, pressure, temperature, and impedance on one time axis. If pressure falls first and high- or mid-frequency impedance subsequently grows together with polarization, contact loss becomes a stronger explanation. If pressure remains stable while interface-related impedance rises, chemical decomposition, space-charge effects, or active-material structural changes require closer examination. Real-time stack-pressure measurements combined with impedance have been used to distinguish interfacial reactions, lithium-filament growth, and mechanical signatures associated with electrolyte density.[2] In a Li/LLZO/Li symmetric cell, acoustic attenuation, rapid polarization, and impedance growth at 2 MPa and 0.2 mA cm⁻² provide a concrete example.[2]
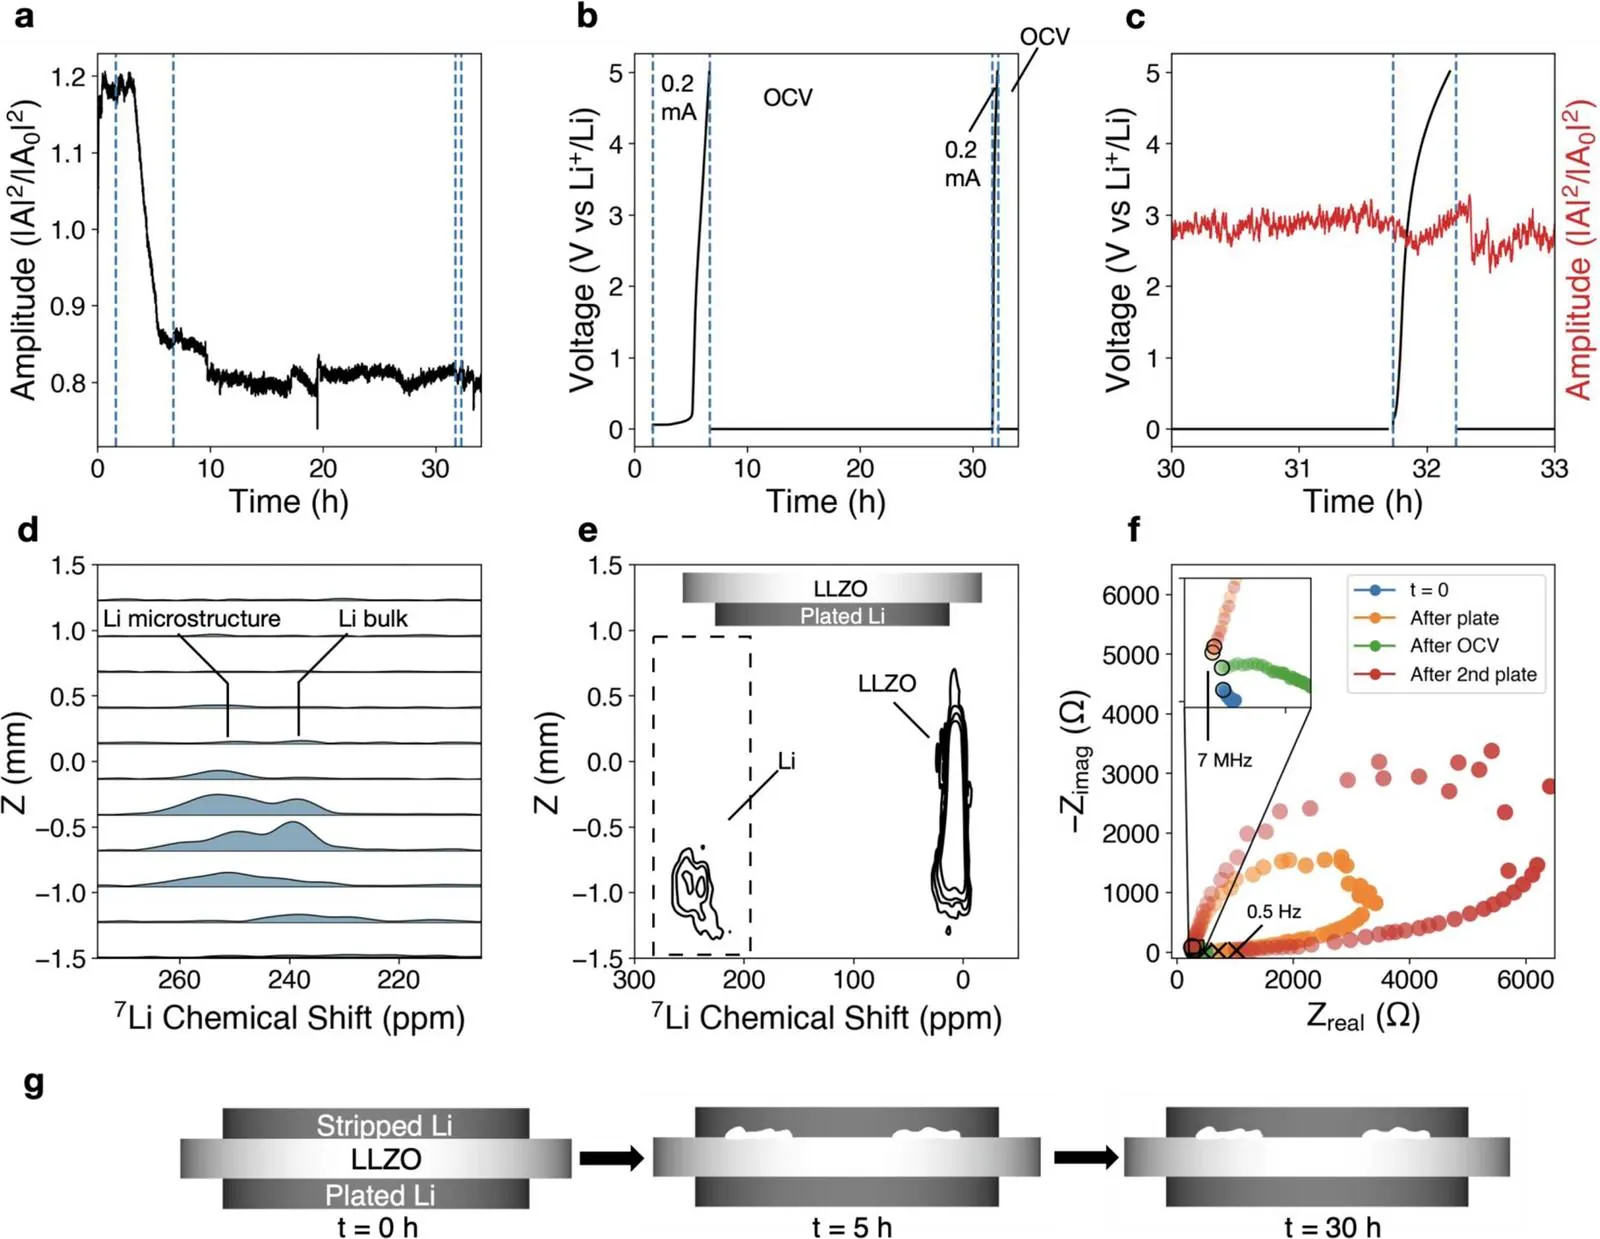
Figure 3. In this Li/LLZO/Li symmetric cell, acoustic amplitude fell rapidly while voltage polarization and interfacial impedance increased at 2 MPa and 0.2 mA cm⁻², showing why low-pressure contact loss should be diagnosed with multiple synchronized signals.
What EIS and DRT can reveal - and what they cannot prove alone
Electrochemical impedance spectroscopy (EIS) measures complex impedance over frequency. Distribution of relaxation times (DRT) analysis then unfolds processes that overlap in a Nyquist plot onto a relaxation-time axis, making it easier to compare which timescale-dependent impedance contributions change with pressure. During a pressure scan, measurements should use the same temperature, state of charge (SOC), rest time, perturbation amplitude, and frequency range. Linearity, stability, and causal consistency should be checked before interpretation.[4]
A DRT peak is not an automatically generated mechanism label. A peak that grows as pressure decreases can suggest an association with contact or an interfacial process, but its position alone cannot prove positive-electrode interface degradation, lithium voiding, or dendrite growth. Attribution should combine equivalent-circuit trends, symmetric-cell or three-electrode controls, pressure-recovery tests, cross-sectional microscopy, and replicate cells. One further boundary is essential: 1 kHz single-frequency AC resistance is useful for rapid screening and tracking, but it cannot replace broadband EIS and cannot directly generate a DRT spectrum.
A reproducible stack-pressure scan workflow
Step 1: Define the question and failure criteria
Decide whether the objective is to find the minimum operating pressure, compare fixture boundaries, investigate lithium voids, or quantify pressure drift during long-term cycling. Predefine endpoints such as capacity retention, polarization, impedance growth, pressure change, or short circuit.
Step 2: Lock the sample and geometry
Record electrolyte chemistry and thickness, active material, areal capacity, N/P ratio, lithium-foil thickness, specimen diameter or electrode area, fabrication pressure, and assembly procedure.
Step 3: Calibrate the mechanical chain
Verify the force-sensor range and zero, measure pressure-plate parallelism, and record fixture stiffness, friction, and thermal drift. Run a no-current pressure hold first and confirm that pressure relaxation meets a predefined stability criterion.
Step 4: Design the pressure levels
Include at least low, medium, and high pressure with independent replicates. If one cell is loaded sequentially, account for irreversible densification and pressure history; an increasing-pressure scan is not automatically equivalent to a decreasing-pressure scan.
Step 5: Standardize thermal and electrochemical states
Fix temperature, soak time, SOC, rest, current density, areal capacity, cutoff voltage, and charge/discharge direction. In lithium-metal systems, examine the plating and stripping interfaces separately.
Step 6: Synchronize multiple signals
Continuously record pressure, displacement or thickness, temperature, voltage, and current. Measure EIS at predefined SOC or cycle checkpoints. The pressure sampling rate must capture step transitions and rapid relaxation.
Step 7: Test reversibility and seek independent confirmation
If impedance recovers after pressure is restored, the result supports a contact contribution. If it does not recover, investigate irreversible chemical or structural damage. Confirm the diagnosis with microscopy, cross-sectional analysis, acoustics, or another independent signal.
Report the boundary conditions required for comparison
A comparable stack-pressure report should include at least the pressure definition and loaded-area convention; fabrication, assembly, and operating pressures; constant-pressure, constant-displacement, or compliant-spring boundary; fixture and sensor location; raw pressure versus time or cycle; temperature, SOC, rest, and current density; cell architecture, areal capacity, and material thickness; EIS frequency range, perturbation amplitude, and consistency checks; and replicate count and variability. Reporting only that a cell was cycled at 5 MPa is not sufficient.
Pressure retention or fluctuation amplitude can also be reported, but never without a time window and reference value. For example, state the pressure change during a specified step relative to the stabilized post-assembly baseline and whether fixture thermal drift was subtracted. This distinction separates true cell expansion from material relaxation and measurement-system drift.
Integrating NEWARE equipment into pressure-electrical testing
The NEWARE Solid-State Battery Mold can support laboratory assembly and external-pressure control in solid-state systems. According to the product page, the mold can be operated in a glovebox, is compatible with pressure sensors, and offers optional data acquisition. For stack-pressure research, its main value is to bring sample geometry, loading method, and the sensor signal into a recordable experimental chain.
Electrical measurements should be assigned according to the question. The BT-9562 uses a 1 kHz AC four-terminal method and measures internal resistance, voltage, reactance, complex impedance, and phase angle. It is suitable for rapid single-frequency AC-resistance screening, sorting, or tracking at cycle checkpoints. Because it is a 1 kHz single-frequency instrument, it cannot replace broadband EIS or serve directly as a DRT deconvolution data source. Resolving interfacial time constants requires a separate electrochemical impedance instrument covering the target frequency range, together with linearity and consistency checks.
The battery cycler and auxiliary channels then align constant-current, constant-voltage, pulse, rest, and cycle steps with pressure, temperature, and other signals. The engineering value does not come from listing equipment names. It comes from tracing when pressure changed, when impedance began to rise, and when polarization appeared on the same clock. Product capability should always be confirmed against the exact model, range, channel configuration, and calibration documentation.
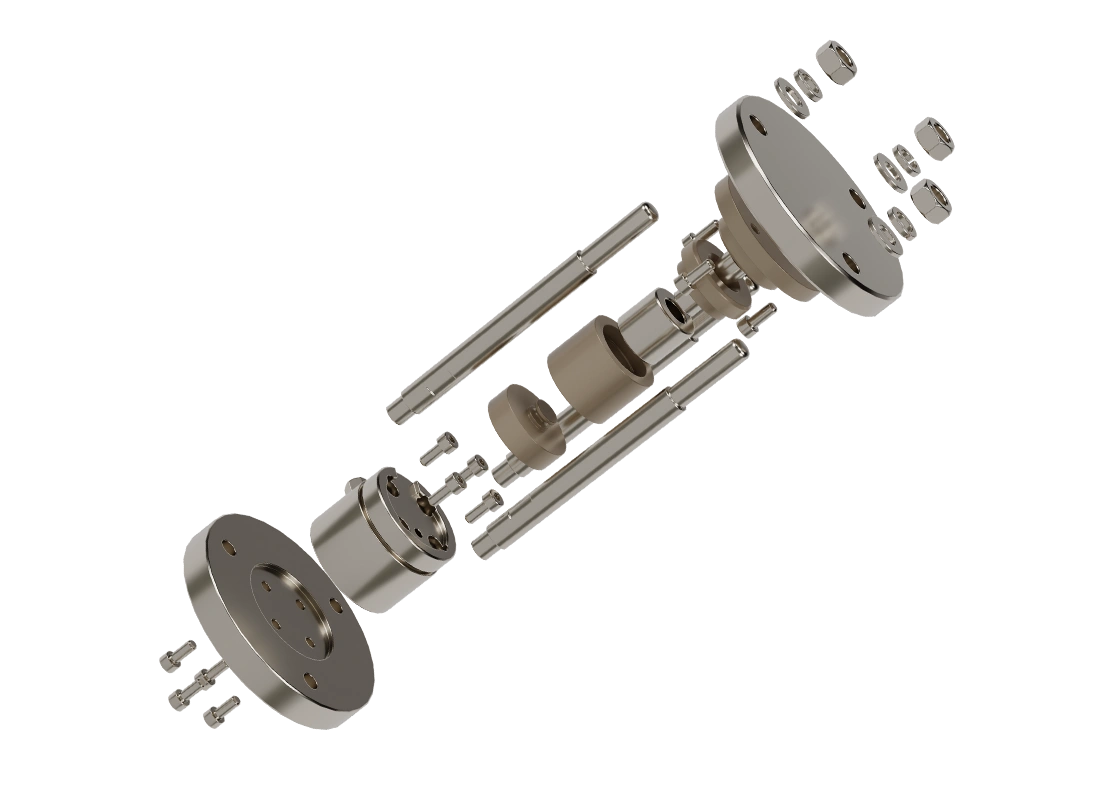
Figure 4. Exploded view of the NEWARE Solid-State Battery Mold.
Conclusion
All-solid-state batteries need stack pressure because solid interfaces do not wet each other spontaneously. Mechanical constraint must establish the real contact area and maintain it through charge-discharge volume changes. Stack pressure is not a one-way performance gain: insufficient pressure causes contact loss, while excessive pressure can promote creep, fracture, and short circuit. The so-called optimum is a working window defined for a particular material system, geometry, current density, temperature, and fixture boundary.
For research and test teams, the most important upgrade is to treat pressure as a measured process variable rather than an assembly note. Separate fabrication, assembly, and operating stack pressure; define whether the fixture imposes constant pressure or constant displacement; synchronize pressure, voltage, current, temperature, and impedance; and validate proposed mechanisms with pressure-recovery tests and independent characterization. Only then can cycle-life results be compared credibly across samples, batches, and laboratories.
References
[1] Zhang, Z. et al. Stack pressure-A critical strategy and challenge in performance optimization of solid state batteries. Energy Storage Materials 2025, 76, 104134. https://doi.org/10.1016/j.ensm.2025.104134
[2] Chang, W. et al. Evolving contact mechanics and microstructure formation dynamics of the lithium metal-Li₇La₃Zr₂O₁₂ interface. Nature Communications 2021, 12, 6369. https://doi.org/10.1038/s41467-021-26632-x
[3] Lee, C. et al. Enhancing electrochemomechanics: How stack pressure regulation affects all-solid-state batteries. Energy Storage Materials 2024, 66, 103196. https://doi.org/10.1016/j.ensm.2024.103196
[4] Wan, T. H. et al. Influence of the Discretization Methods on the Distribution of Relaxation Times Deconvolution. Electrochimica Acta 2015, 184, 483-499. https://doi.org/10.1016/j.electacta.2015.09.097