Introduction
In the battery and energy storage industries, ESS (Energy Storage System) batteries and EV (Electric Vehicle) power batteries are frequently compared. While both share the core lithium-ion electrochemical framework, their drastically different application environments impose radically distinct design priorities, performance boundaries, and testing validations.
This comprehensive guide breaks down the top 10 technical differences between EV and ESS batteries and addresses how these variations reshape battery testing requirements.
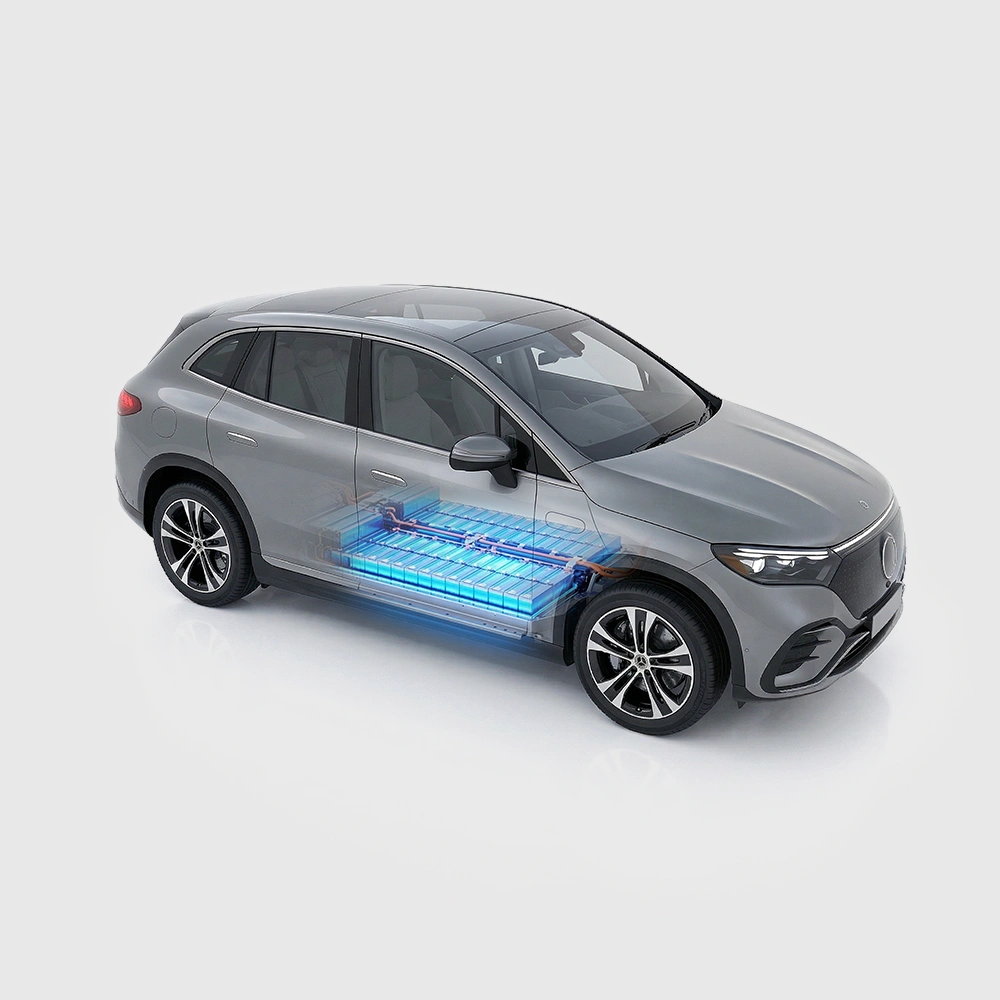
EV vs ESS battery applications
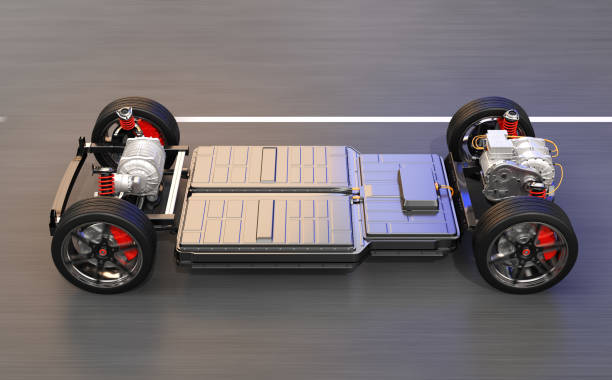
EV batteries: Installed inside electric passenger or commercial vehicles where space and weight are highly constrained. Their primary mandate is providing high instantaneous power during acceleration and accepting high power during fast-charging sessions. A typical consumer EV undergoes 0.2-0.5 deep cycles daily, whereas commercial operating vehicles may hit 2-3 deep cycles.
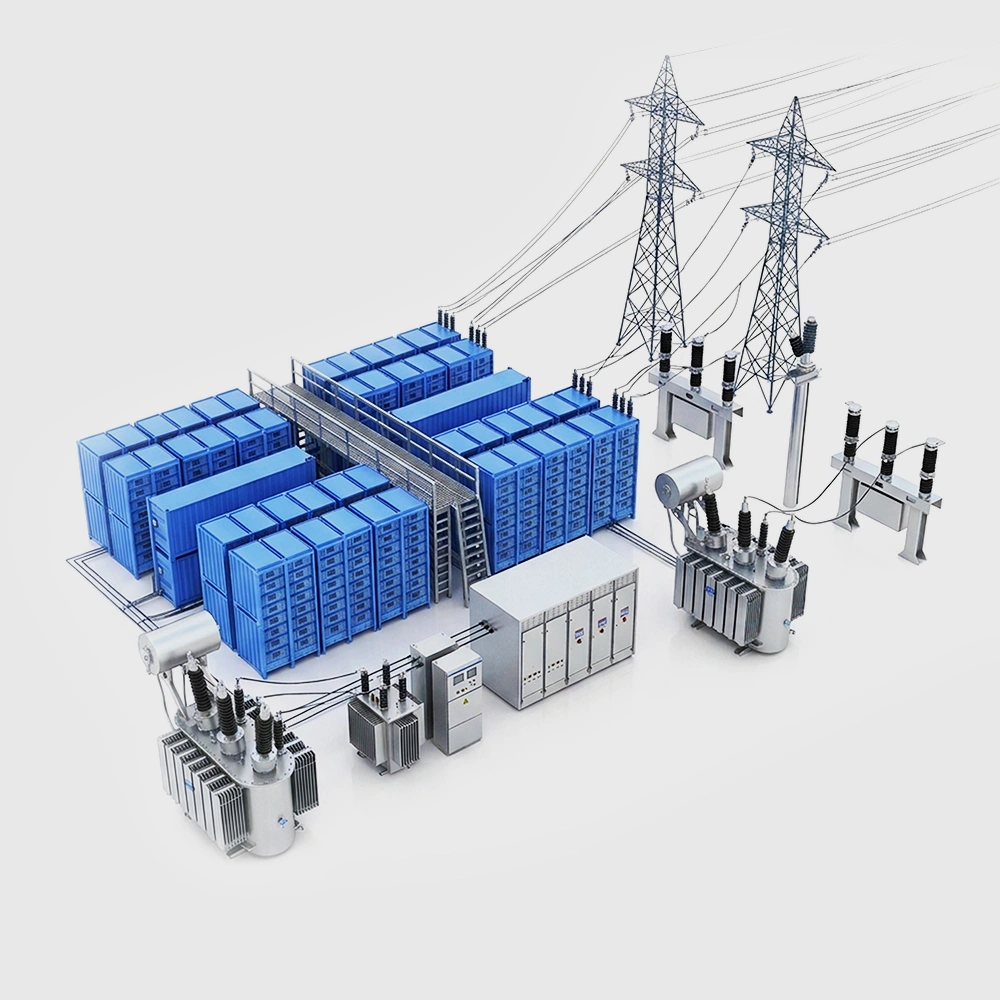
ESS batteries: Deployed in stationary grid-scale, commercial, or residential installations. Weight and volume are secondary to Levelized Cost of Storage (LCOS). ESS systems undergo 0.5-2 full cycles daily for peak-shaving applications. However, in frequency regulation helper services, they may execute 10-20 shallow cycles per day. The target operational life spans 15-25 years—vastly exceeding the 8 to 10 years typical of EV packs.

Battery specifications and C-Rates
EV batteries: Push the physical limits of energy density. Lithium Iron Phosphate (LFP) variants achieve 140–180 Wh/kg, while Nickel-Manganese-Cobalt (NCM) chemistries reach 200–270 Wh/kg, with high-nickel premium cells nearing 300 Wh/kg. In terms of power density, EV cells must sustain continuous 1C-3C charging/discharging, with peak performance reaching 10C-15C.
ESS batteries: Operate at lower gravimetric densities (90–160 Wh/kg). Continuous charge/discharge rates are highly conservative—typically sitting between 0.125C and 1C. For instance, a 2-hour system relies on 0.5C, a 4-hour system on 0.25C, and an 8-hour long-duration energy storage (LDES) system drops down to 0.125C.
Below is the definitive comparison of their core electrical performance profiles:
| Specification Metric | EV Power Battery | ESS Battery |
| Gravimetric Energy Density | 140 – 270 Wh/kg (NCM reaches 280–300 Wh/kg) | 90 – 160 Wh/kg |
| Volumetric Energy Density | 250 – 650 Wh/L | 200 – 280 Wh/L |
| Continuous Discharge Rate | 1C – 5C | 0.125C – 1C |
| Peak Discharge Rate | 10C – 15C (Acceleration conditions) | 1C – 2C |
| Round-Trip Efficiency (RTE) | 95% – 98% (@ 1C rate) | 92% – 96% (@ 0.5C rate) |
| Nominal Voltage (Single Cell) | LFP: 3.2V; NCM/NCA: 3.6 – 3.7V | LFP: 3.2V |
NEWARE Engineer's Testing Note: Evaluating the 10C–15C peak discharge profiles of EV batteries requires ultra-fast pulse testing capabilities. NEWARE's High-Power Battery Test Systems feature millisecond-level response times and high-accuracy dynamic profile simulations to recreate real-world driving conditions flawlessly.
Battery cycle life and degradation
Degradation tracking represents one of the most stark divisions between EV and ESS engineering. While automotive cells prioritize high initial capacity, ESS cells sacrifice initial energy density to maintain prolonged structural and chemical equilibrium.
| Life & Degradation Metrics | EV Power Battery | ESS Battery |
| LFP Cycle Life (to 80% SOH) | 3,000 – 8,000 cycles | 8,000 – 12,000 cycles (Premium cells reach 15,000) |
| NCM Cycle Life (to 80% SOH) | 1,000 – 2,000 cycles | Practically phased out due to cost and lifetime bottlenecks |
| LDES Cycle Life (to 70% SOH) | N/A | 10,000 – 20,000 cycles (Next-gen cells claim up to 20,000) |
| Designed Calendar Life | 8 – 12 years | 15 – 25 years |
| Standard Industry Warranty | Typically 8 years or 150,000 km | Contractually tied to the project's asset lifecycle and LCOS |
Cell capacity and form factors
The architectural logic of cell sizing stems from differing integration restrictions. EVs utilize small, highly modular form factors for superior heat rejection and flexible pack layouts. ESS configurations exploit massive, high-capacity cells to minimize structural overhead, connection points, and system complexity.
| Dimension & Form Factor | EV Power Battery | ESS Battery |
| Mainstream Single Cell Capacity | 50 – 150 Ah (e.g., BYD Blade Cell ~135Ah, 4680 Cylindrical ~26Ah) | 280Ah / 314Ah dominates (Rapidly shifting toward 500Ah – 1,300Ah for LDES) |
| Single Cell Weight | Light (A 100Ah EV cell averages 1.6 – 2.0 kg) | Heavy (280Ah weighs 5.2 – 5.6 kg; 314Ah weighs 5.8 – 6.2 kg) |
| Enclosure & Safety Venting | Prismatic aluminum cans, pouch, or cylindrical; heavily optimized for tight chassis integration | Prismatic rigid steel/aluminum hard cases; premium designs adopt dual pressure-relief valves for enhanced gas exhaust |
Looking to test the next generation of massive ESS cells? Check out the NEWARE CE-6000 Series High-Precision ESS Cell Testers, engineered specifically to support continuous, high-accuracy degradation tracking for 280Ah, 314Ah, and emerging 500Ah+ large-format cells.
Material formulation and chemistry
Though both applications rely heavily on Lithium Iron Phosphate (LFP) chemistry for safety, their micro-level electrode properties are deeply divergent:
| Process Parameter | EV Power Battery | ESS Battery |
| Cathode Chemistry Selection | Co-existence of LFP and High-Nickel NCM (e.g., NCM811) | LFP represents an absolute monopoly (>95% market share) |
| Cathode Particle Morphology | Sub-micron, smaller particle sizing (LFP primary particles: 200–500nm) to shorten Li+ diffusion paths and boost rate performance. Trade-off: High Specific Surface Area (BET: 10–25 m2/g) raises electrolyte side reactions. | Large particle sizing (5–15μm) optimized in a single-crystal morphology to prevent particle micro-cracking during deep cycling. Advantage: Lower surface area (BET: 5–12 m2/g), minimal side reactions, and low self-discharge. |
| Anode Particle Sizing | Finer grains (Milled Artificial Graphite D50: 10–15μm) | Coarser grains (Artificial Graphite D50: 18–25μm) |
| Electrode Compaction Density | High density (Cathode LFP: 2.3–2.6 g/cm3; Anode: 1.5–1.8 g/cm3) | Low density (Cathode LFP: 2.0–2.4 g/cm3; Anode: 1.3–1.6 g/cm3) providing deliberate void porosity for long-term volumetric cycling buffer. |
| Separator Thickness & Choice | 12 – 20 μm Wet-process separator maximizing puncture strength and thin-profile layout. | 20 – 32 μm Dry- or Wet-process separator; thicker profile provides a physical buffer against lithium dendrite penetration over decades. |
| Electrolyte Dosing & Recipe | Low-viscosity solvents + high-conductivity lithium salts (LiPF6 at 1.2–1.5M); conservative filling volume (4–6 g/Ah). | Heavy loading of film-forming (VC, FEC) and anti-gassing additives; generous filling excess (5–8 g/Ah) to act as a lithium reservoir for multi-decade loss mitigation. |
Thermal performance and safety
The differing operational environments dictate completely separate thermal management margins and thermal runaway (TR) characteristics:
Operating Temperature Windows:
EV Batteries: Optimal window sits at 25°C to 40°C. Low-temperature discharge is allowed down to -30°C (NCM retains 80%–90% capacity, LFP yields 60%–70% capacity with internal heating assistance), but charging below 0°C is strictly restricted. High ambient operation (>45°C) accelerates calendar aging, demanding aggressive active liquid cooling.
ESS Batteries: Optimal thermal window is tighter (15°C to 35°C). Minimum allowed discharge cutoff stops at -20°C, and sub-zero performance is intentionally restricted (retaining only 50%–65% capacity at -20°C).
Thermal Runaway & Gas Venting Profiles:
Automotive NCM triggers early (150°C–200°C), spiking dramatically to extreme peak runaway temperatures of 800°C–1000°C alongside large gas emissions (1.5–2.5 L/Ah).
ESS/EV LFP boasts higher thermal robustness, with TR triggering at 250°C–300°C and capping peak temperatures between 400°C–600°C. Stationary-grade LFP cells restrict gas evolution profiles further to roughly 0.8–1.5 L/Ah.
Pack integration and BMS topologies
From a pack integration standpoint, an automotive system emphasizes dynamic acceleration safety, while stationary storage scales vertically into high-voltage sub-stations.
Voltage Platforms & Parallel Architecture:
EV Battery Packs: Formed of 96 to 120 cells in series for 400V setups, or 192 to 216 cells in series for advanced 800V architectures. Parallel configurations are kept low (typically 1 to 4 strings) to isolate circulating currents. Volumetric integration efficiency is high (60%–80%).
ESS Containers: Series counts stack from 200 to over 400 cells, driving DC bus voltages upward into the 800V to 1500V range. Dozens to hundreds of strings run in parallel, demanding extreme cell-to-cell consistency. Continuous active balancing is mandatory to prevent string mismatch losses.
Thermal Management & BMS Topologies:
EV Packs: Dominated entirely by active liquid cooling loops, with auxiliary parasitic loads accounting for 3% to 5% of pack energy. BMS setups leverage decentralized master-slave nodes communicating via automotive-grade CAN bus.
ESS Containers: While older or lower C-rate installations relied on HVAC forced-air cooling, modern high-density containers utilize closed-loop liquid cooling plates, keeping auxiliary consumption at 1% to 3%. The BMS utilizes a 3-tier or 4-tier topology (Cell → rightarrow → Cluster → rightarrow→ Stack → rightarrow → Plant) running over CAN, Modbus, and utility-scale IEC 61850 protocols.
Cost structures & value drivers
According to industry data, manufacturing scale-ups for large-format stationary cells have decoupled the cost composition of these two markets:
| Cost Framework Metric | EV Power Battery | ESS Battery |
| Cell-Level Cost | LFP: $60 – $75 / kWh NCM: $75 – $95 / kWh | FP: $50 – $65 / kWh (NCM is economically unviable) |
| System-Level Cost (Fully integrated) | $110 – $150 / kWh (Automotive Pack level) | $100 – $160 / kWh (Turnkey Container with BOS) |
| Primary Cost Driver | Raw material active mass claims 60% – 70% with pure lithium carbonate/hydroxide making up 25% – 35% of total cost. | Balance of System (BOS) electronics and fire-suppression claim more share Active raw materials drop to 50% – 60% (Lithium elements make up 20% – 30%). |
Battery testing standards, EV battery compliance
Because they feed separate industrial ecosystems, validation tracking splits down the middle between automotive safety and high-power utility grid compliance:
EV Battery Testing Standards (Automotive Framework):
China Mandates: GB 38031 (Pack safety), GB/T 31485 (Cell-level safety), GB/T 31467 (System operation).
Global Logistics & Target Markets: UN38.3 (Transportation safety), UL 2580 (North American automotive entry), ECE R100 (European homologation).
Functional Safety: Strict enforcement of ISO 26262, requiring validation up to ASIL C or D classifications.
ESS Battery Testing Standards (Grid & Utility Framework):
China Standards: GB/T 36276 (Crucial core specification for stationary lithium cells), GB/T 36558, GB 51048.
International Core Compliance: UL 9540A (Thermal runaway flame propagation evaluation), IEC 62619 (Safety requirements for industrial applications).
Grid Interconnection & Functional Safety: Covered under IEEE 1547, UL 1741, and VDE-AR-N 4105; functional safety aligns with IEC 61508 (SIL 2 or SIL 3) or IEC 60730.
Ensure absolute compliance for your product launches: Neware's full suite of testing hardware is engineered to execute automated test scripts fully compliant with GB/T 36276, IEC 62619, and global automotive lifecycle regulations.
Core failure modes & reliability metrics
EV batteries:
Dominant failure modes: High-rate fast charging causes localized lithium plating (dendrite formation). Mechanical vibrations induce NCM particle micro-cracking and eventual binder degradation. Catastrophic failures typically stem from structural deformation, impact, or foreign object debris causing severe internal short circuits (ISC).
Reliability targets: Cell-level target defect rates must be exceptionally tight (<100 ppm). End of Life (EOL) is sharp and irreversible, marked by rapid capacity drop and internal resistance spikes. Field servicing is done strictly by replacing full modules—cell-level repair is impossible.
ESS batteries:
Dominant failure modes: Dominated by predictable electrochemical wear, such as continuous SEI layer growth, electrolyte dry-out, and slow, linear active lithium consumption. Internal shorts develop at a much slower, non-catastrophic velocity.
Reliability targets: Because a single utility plant integrates hundreds of thousands of cells, acceptable single-cell field failure envelopes span broader limits (500 to 1,000 ppm). EOL is highly predictable and linear. Modular topology design allows technicians to conduct field swapping down to individual cells or clusters, ensuring superior system maintainability.
Conclusion: matching testing hardware to battery design
Understanding that EV and ESS batteries optimize for entirely opposing performance curves is critical for testing success. EV testing demands extreme dynamic response, high power output, and rigorous environmental simulation. Conversely, ESS testing demands multi-year high-precision accuracy, rock-solid long-term calibration, and multi-channel stability to map 10,000+ lifecycle curves reliably.
As a world-leading provider of battery testing systems, Neware delivers specialized, high-performance testing hardware tailored exactly to these unique challenges. Whether you require microsecond pulse controls for EV drive-cycle simulation or high-density, multi-channel setups for GB/T 36276-compliant ESS lifecycle tracking, Neware is your ultimate laboratory partner.
[Contact NEWARE's Application Engineers Today] to configure the ideal testing solution for your laboratory.