A Guide to Avoiding Pitfalls and Standardizing Operations in Electrochemical Impedance Spectroscopy
In battery R&D and quality control, Electrochemical Impedance Spectroscopy (EIS) is hailed as the "microscope" for peering into the microscopic reactions inside a battery. However, many engineers frequently encounter confusing anomalies during practical testing: why do multiple consecutive impedance spectrum curves of the exact same battery fail to overlap? Why does the intersection point in the high-frequency region constantly drift? Or why do the resolved fitting data defy all logic?
EIS is a dynamic measurement technique that is extremely sensitive to testing conditions. Discrepancies in data are rarely caused by issues with the battery itself; instead, they usually stem from minor oversights in testing specifications, fixture connections, or environmental control. This article will systematically break down the seven core pain points most commonly encountered in battery EIS testing and provide standardized operational recommendations.
Pain point 1: insufficient rest time — disrupting the battery's "Ecological Balance"
Phenomenon & root cause:
Initiating an EIS test immediately after a charge-discharge cycle or an HPPC test often results in a distorted Nyquist plot, or even strange "tails" appearing in the low-frequency region. This happens because the battery has just undergone heavy current stimulation; the internal lithium-ion concentration gradients have not yet dissipated, and the positive/negative electrode surfaces remain in a state of severe polarization. Consequently, the system fails to meet the core prerequisite of EIS testing — stability.
Standardized operational recommendations:
Batteries must undergo sufficient rest periods after any state change (such as charging/discharging or temperature adjustments).
For coin cells, a rest period of over 2 hours is recommended. For large-capacity pouch or prismatic cells, a rest period of 4 to 12 hours is advised, or until the hourly variation in Open Circuit Voltage (OCV) drops below 1 mV.
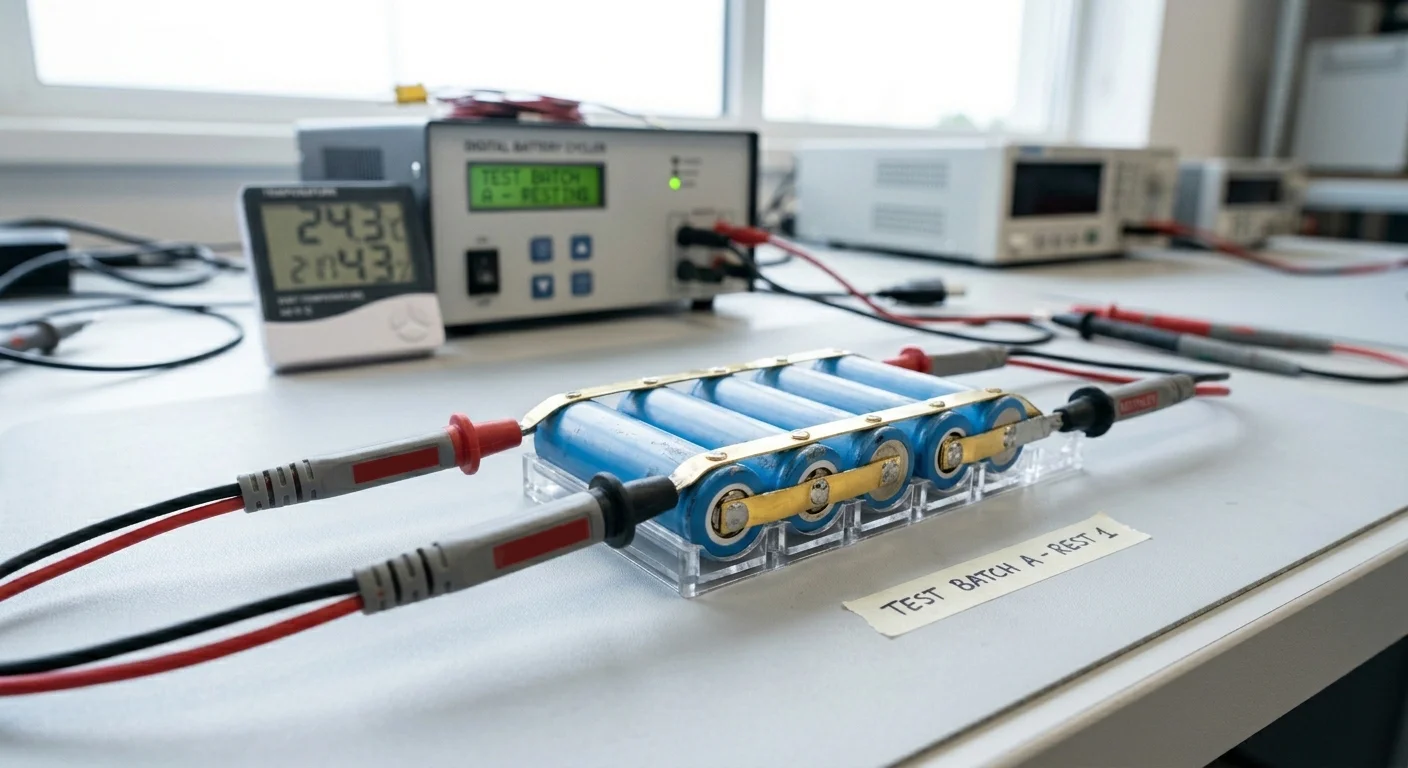
Figure 1: rest after test
Pain point 2: "Artifacts" introduced by the reference electrode — the invisible killer in Three-Electrode testing
Phenomenon & root cause:
To study the impedance of the positive or negative electrode individually, researchers frequently utilize three-electrode experimental cells. However, the resulting cathode or anode impedance spectra often display inexplicable distortions (such as unnatural loops or twists) in the inductive or high-frequency regions. This is typically caused by an asymmetrical placement of the reference electrode (RE), excessive contact resistance, or capacitive coupling between the reference circuit and the working circuit, which generates unauthentic "artifacts" in the electrical signal.
Standardized operational recommendations:
Geometric symmetry: Ensure that the reference electrode (such as a lithium chip or wire) is placed precisely at the midpoint edge of the positive and negative electrodes. The geometric positioning must be highly symmetrical to prevent uneven distribution of current lines.
Reduce reference impedance: Ensure excellent contact between the reference electrode and the electrolyte, and when necessary, enable the "high input impedance buffer" in the testing software to isolate interference from the reference circuit.

Figure 2: Schematic diagram of three-electrode connection using alligator clip
Pain point 3: fixture and lead resistance — the "Invisible Gain" in high-frequency regions
Phenomenon & root cause:
When testing large-capacity, low-internal-resistance batteries, the high-frequency ohmic internal resistance (Re, the intersection of the curve with the real axis) varies with every single test. Even a slight nudge to the cables can shift the impedance arc. This occurs because the contact resistance of the test fixtures and the parasitic inductance/resistance of the leads themselves are inevitably incorporated into the test results. In micro-ohm or milli-ohm scale battery testing, the fluctuations in contact resistance from ordinary fixtures are large enough to completely overshadow the battery's true impedance variations.
Standardized operational recommendations:
Adopt the "Four-Wire Method" (Four-Terminal Method): The current-driving leads and voltage-sensing leads must make independent contact as close as possible to the battery tabs/terminals, entirely eliminating shared leads.

Figure 3: Four-wire connection explanation
Eliminate direct alligator clip connections: For large, low-resistance batteries, dedicated heavy-duty pneumatic fixtures or bolted tooling should be used, and keep the leads as short as possible to eliminate additional parasitic impedance to the greatest extent.
Pain point 4: minute fluctuations in ambient temperature — the underestimated arrhenius effect
Phenomenon & root cause:
Testing EIS openly on a laboratory benchtop often yields conflicting curves between morning and afternoon sessions. This discrepancy arises because the charge transfer impedance (Rct) and ion diffusion inside the battery are extremely temperature-dependent, adhering to the Arrhenius law:
%20%5Cpropto%20%5Cfrac%7BE_a%7D%7BR%20%5Ccdot%20T%7D)
Where Ea is the activation energy, R is the gas constant, and T is the absolute temperature. A mere 2 °C shift in temperature can cause the charge transfer impedance to fluctuate by more than 10%.
Standardized operational recommendations:
Climate chambers are a necessity: Place the batteries inside a high-precision thermal chamber (e.g., 25±0.5 °C) for testing.
Thermal equilibrium is critical: After altering the chamber temperature, allow a rest period of at least 1 to 2 hours to ensure the internal core temperature of the battery is completely synchronized with the environment before starting the test.
Pain point 5: improper excitation amplitude — violating the linear region or being smothered by noise
Phenomenon & root cause:
Excessive amplitude (e.g., >20 mV): A battery is a highly complex, non-linear system, and a foundational prerequisite for EIS testing is a linear response. If the voltage excitation signal is too large, it forces the battery into a non-linear zone, distorting the impedance semicircles and rendering the fitted kinetic parameters entirely inaccurate.
Insufficient amplitude (e.g., <1 mV): The response signal becomes too weak, making the high- or low-frequency response currents highly vulnerable to being smothered by system noise or power grid frequency interference, which leaves dense noise spikes ("burrs") all over the spectrum plot.
Standardized operational recommendations:
Conventional batteries: For conventional batteries, the amplitude under Potentiostatic EIS (PEIS) mode is typically strictly controlled between 5 mV and 10 mV.
Large, Low-Resistance batteries: For large, low-resistance cells (such as 280Ah energy storage cells), it is recommended to switch to Galvanostatic EIS (GEIS) mode, keeping the current amplitude between 0.02C and 0.05C. Concurrently, you must monitor and ensure that the resulting voltage response swing remains safely within the 5 mV to 10 mV linear range.
Pain point 6: setting the Low-Frequency cutoff too low — falling into hours of "Data Drift"
Phenomenon & root cause:
To fully observe the solid-phase diffusion process of lithium ions within active materials, many engineers blindly set the cutoff frequency extremely low (e.g., 0.1 mHz or lower). Low-frequency data points demand exceedingly long sampling periods; measuring a single point can take tens of minutes or even hours. Over this protracted timeframe, the battery's internal State of Charge (SOC), core temperature, and minor side reactions undergo subtle shifts. This directly shatters the causality and stability required for valid EIS, causing the low-frequency curve to fluctuate erratically.
 test comparison.")
Figure 4: Nyquist and Bode plots showing low-frequency data drift paired with Kramers-Kronig (K-K) test comparison. (Data Source: Pine Research Instrumentation, "Kramers-Kronig Analysis of Stable and Drifting EIS Data")
Standardized operational recommendations:
Unless specifically researching ultra-slow diffusion kinetics, setting the low-frequency cutoff to 10 mHz or 100 mHz is generally sufficient to meet the demands of industrial applications and routine screening.
When ultra-low frequency testing is mandatory, the total duration of a single test must be compressed as much as possible. Following the test, the validity of the data must be verified via Kramers-Kronig (K-K) residual analysis to eliminate invalid data points caused by time-domain drift.
Pain point 7: magnetic field coupling in battery fixtures — the "Antenna Effect" of High-Current cables
Phenomenon & root cause:
At high-frequency bands (e.g., >1 kHz), the alternating current within the testing circuit of a large-capacity battery generates a faint, alternating magnetic field. If your voltage-sensing leads run parallel and close to the current-driving leads, the current lines act like an "antenna," inducing magnetic field signals onto the voltage lines. This creates an artificial, massive inductive arc at the upper tip of the high-frequency region on the Nyquist plot.
Standardized operational recommendations:
Twisted pair layout: The positive current/voltage leads must be twisted together into one twisted pair, and the negative current/voltage leads into another. This leverages the principle of spatial magnetic field cancellation to suppress high-frequency inductive reactance.
Spatial isolation: Maintain a clear physical distance between the positive and negative cable pairs, avoiding any crossovers or overlaps.
Summary: standardized EIS testing checklist
| Inspection item | Standard | Purpose |
| Rest period | Rest > 2h (small cells) / > 4h (large cells) after charging/discharging | Eliminate concentration polarization; ensure the system is in a steady state |
| Wiring method | Strict four-wire system; connection terminals free of oxidation layers | Eliminate interference from leads and contact resistance |
| Environmental temp control | Conduct tests within a climate chamber; temperature fluctuations < 0.5 °C | Eliminate the impact of temperature fluctuations on kinetic parameters |
| Excitation amplitude | Generally set between 5 and 10 mV in potentiostatic mode | Ensure the test is conducted within the linear response region |
In summary, strict adherence to a standardized testing workflow is the absolute prerequisite for acquiring high-quality EIS data. Furthermore, when dealing with multi-channel, high-throughput screening of battery kinetics or long-term degradation evolution studies, the hardware stability of the test equipment itself and the consistency across channels form the fundamental hardware foundation that dictates the upper limit of data reproducibility.
NEWARE's high-precision battery testing systems are deeply integrated with electrochemical analysis modules. Utilizing full-channel four-wire high-frequency sampling alongside outstanding physical anti-interference architecture, our hardware natively eliminates "artifacts" and measurement errors stemming from fixtures and system drift. Whether for pioneering academic exploration or industrial-grade failure analysis, NEWARE guarantees that every set of your R&D data remains as robust and pristine as the first, empowering global battery research and industrialization to stride toward a more precise future.
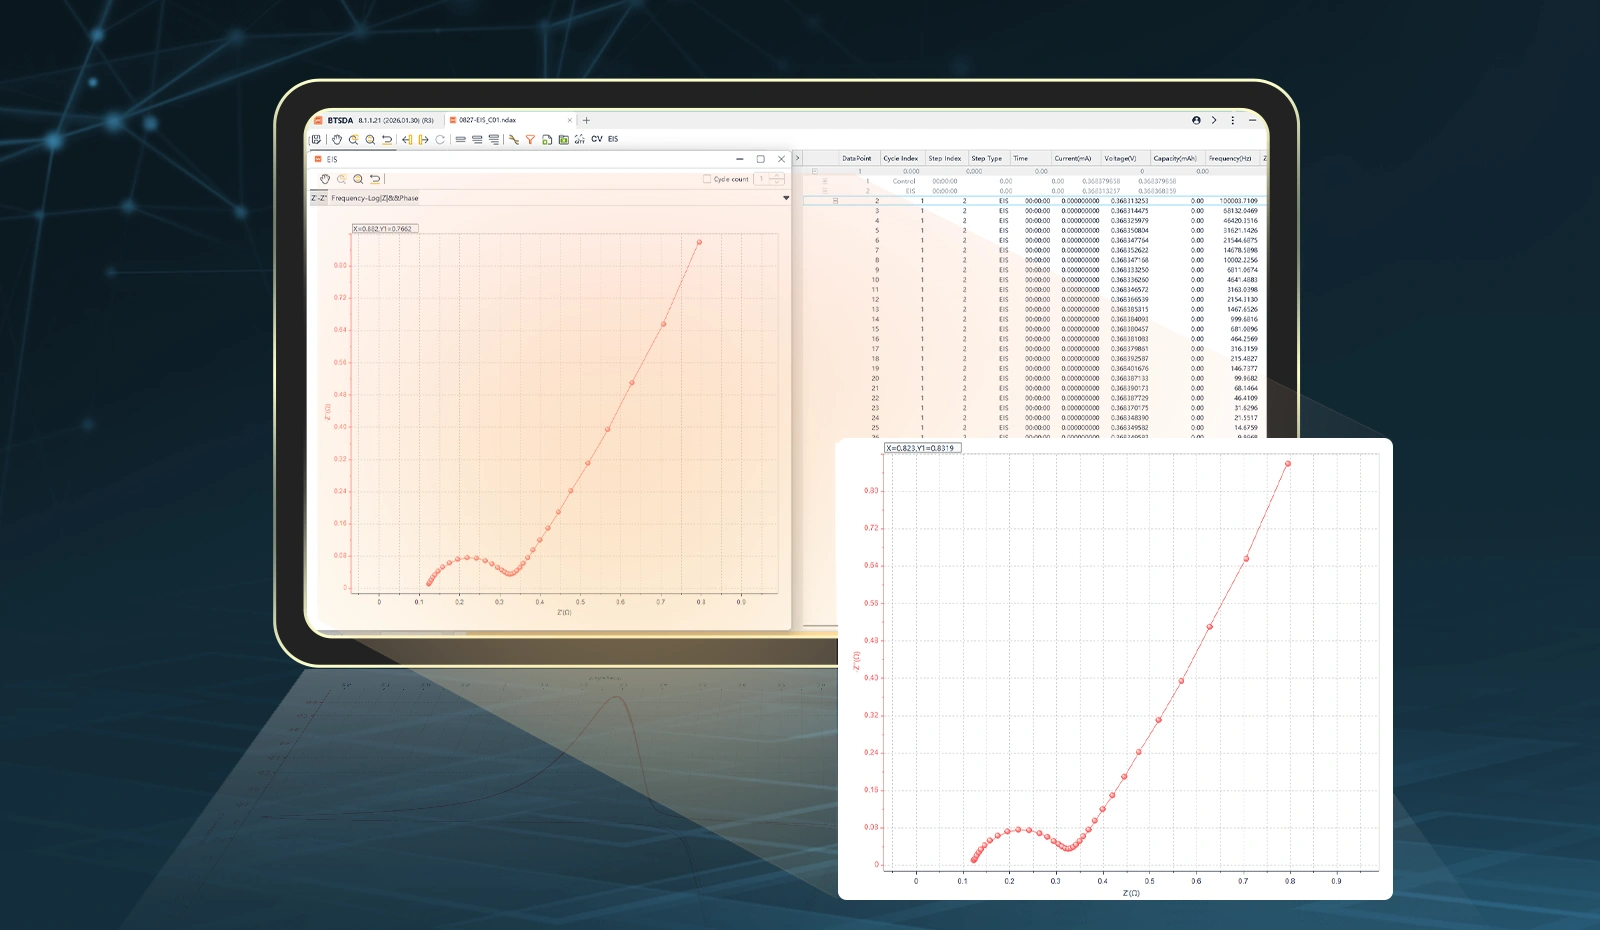
Figure 5: CT-8002S-5V100mA-EIS-EIS test