The performance bottleneck of sodium-ion batteries is increasingly focused on the interface between cathode materials and electrolytes. This article systematically explains how cyclic voltammetry (CV) and electrochemical impedance spectroscopy (EIS) work synergistically to reveal the evolution patterns and degradation mechanisms of interfacial kinetics. Through multi-scan rate CV analysis, researchers can quantify the contribution ratios of capacitive and diffusion behaviors, while EIS analysis combined with distribution of relaxation times (DRT) precisely separates coupled processes such as charge transfer, interfacial film growth, and bulk diffusion. The correlation analysis of the two sets of data provides quantitative evidence for understanding failure mechanisms like surface reconstruction and transition metal dissolution during high-voltage cycling. Finally, the article looks forward to how machine learning and high-throughput platforms can advance this synergistic analysis paradigm toward intelligent and standardized development, supporting the R&D and industrialization of sodium-ion battery materials.
1. The core issue: why is CV/EIS synergistic analysis needed?
In the development of sodium-ion batteries, capacity fade is often difficult to attribute to a single mechanism. Is it due to structural collapse of the active material, consumption of active substances by interfacial side reactions, or blockage of ion transport channels? A single testing method can only reveal partial information, making comprehensive diagnosis challenging. The synergistic analysis of CV and EIS is akin to combining "clinical symptom observation" with "imaging examination" in medicine: CV captures the dynamic characteristics of reactions, while EIS provides a detailed view of the interfacial impedance structure, enabling a systematic analysis of complex interfacial behaviors[1].
2. CV: capturing dynamic features of interfacial reactions
CV records reaction currents through linear voltage scanning, and its curve shapes contain rich interfacial information.
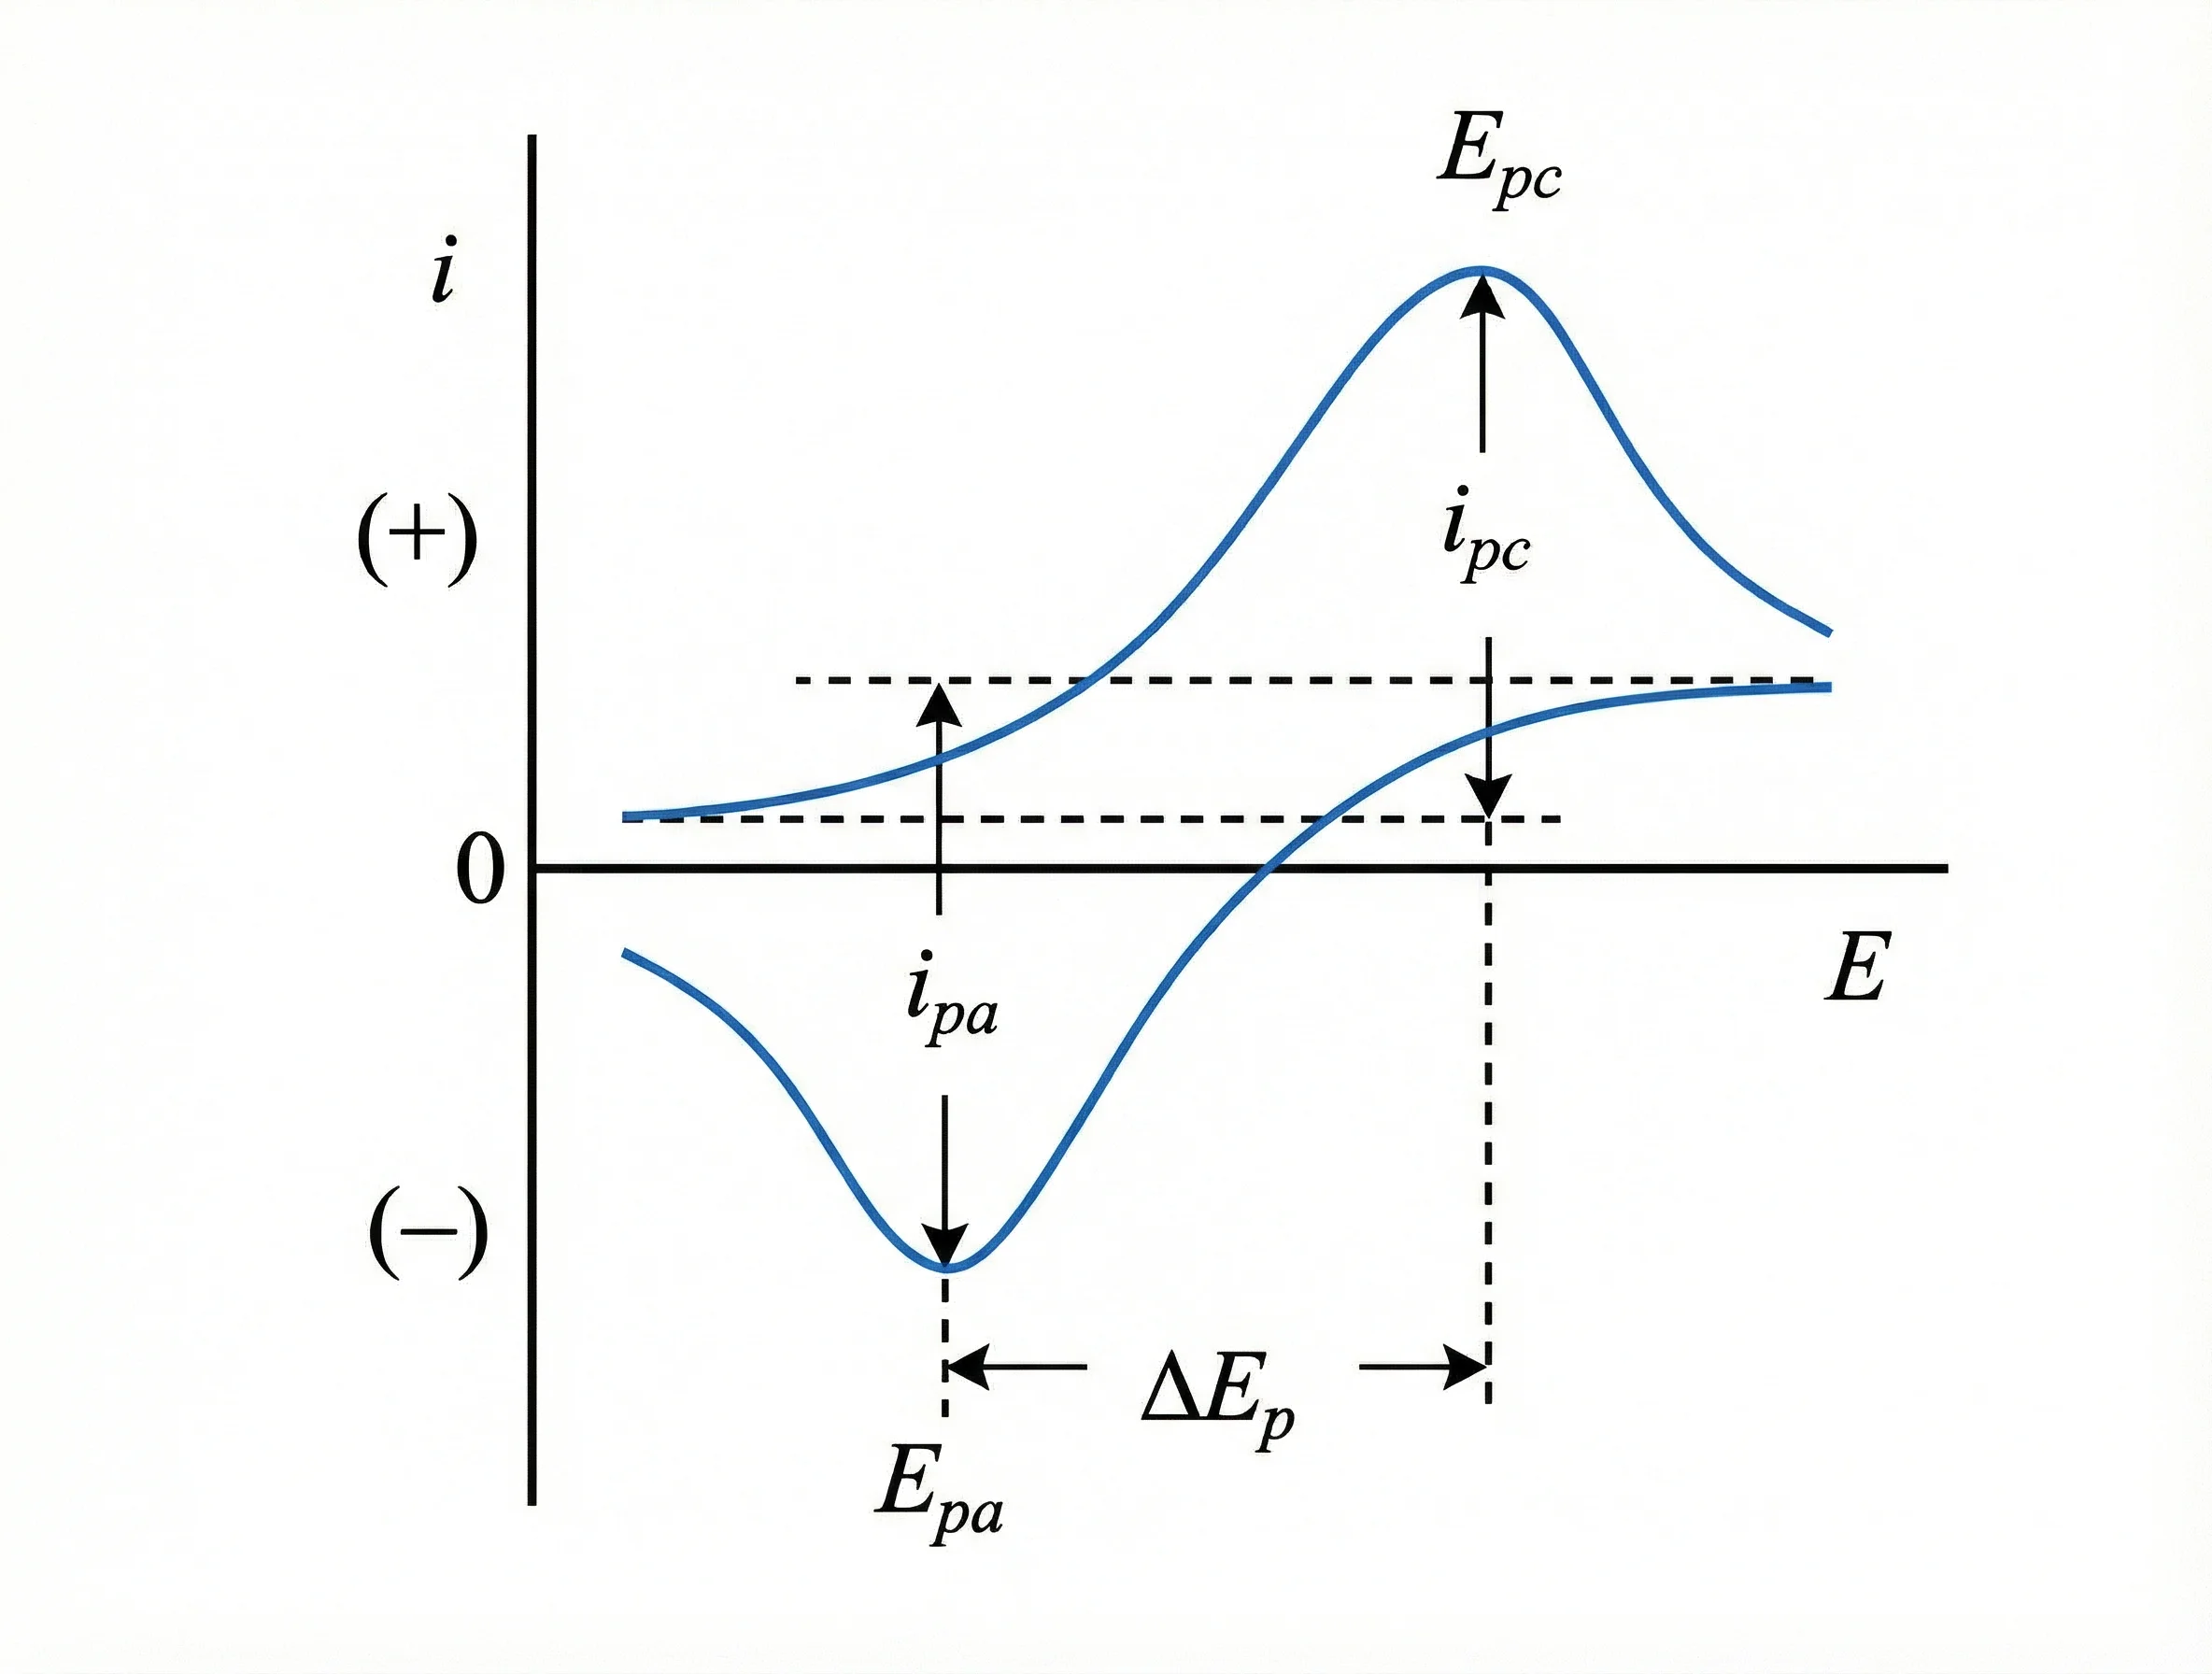 Figure 1
2.1 Indicators of reaction reversibility and kinetics
The potential difference between oxidation and reduction peaks (ΔEₚ) is a key indicator for evaluating reaction reversibility and kinetic rates. A smaller ΔEₚ that does not significantly increase with scan rate indicates higher reversibility and faster kinetics. For example, in NaNi₀.₅Mn₀.₅O₂ materials, ΔEₚ increases from 85 mV to 210 mV during cycling, directly reflecting the deterioration of interfacial reaction kinetics[2].
2.2 Quantitative analysis of energy storage mechanisms
By analyzing the relationship between peak current and scan rate in CV tests at different scan rates, the contributions of surface capacitive behavior and bulk diffusion control can be distinguished. Higher capacitive contribution generally correlates with better rate performance. Studies show that carbon-coated Na₄Fe₃(PO₄)₂(P₂O₇) cathodes maintain stable capacitive contributions after cycling, while uncoated samples show significant declines, indicating that surface modification helps sustain fast interfacial reaction pathways[3].
3. EIS: impedance microscopy for visualizing interfacial structure
EIS can non-destructively quantify the resistance of various interfacial processes, providing high-resolution impedance information.
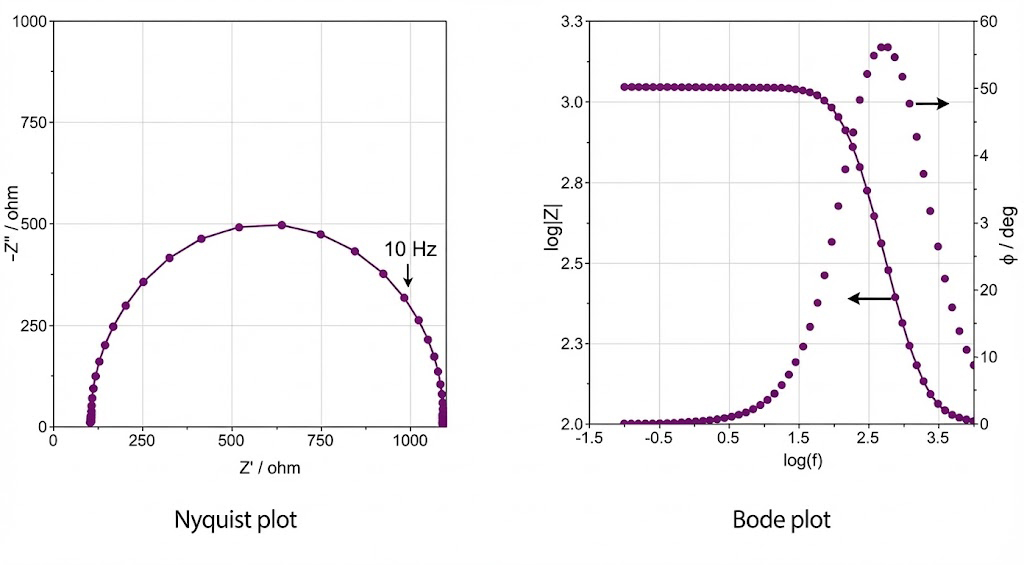
Figure 2
3.1 From equivalent circuits to DRT: the evolution of impedance analysis
Traditional equivalent circuit fitting methods are subjective and struggle to accurately separate overlapping relaxation processes. DRT, as a model-free mathematical tool, deconvolutes overlapping impedance arcs into independent relaxation peaks, precisely identifying processes such as charge transfer, interfacial film transport, and bulk diffusion. For example, in the degradation analysis of Na₃V₂(PO₄)₃ cathodes, DRT clearly separates three main peaks and quantitatively shows that diffusion impedance increases nearly ninefold, far exceeding the growth in charge transfer resistance[4].
 and several spectra (lower panel) into different DRTs")
Figure 3:Schematic diagram of the conversion of one impedance spectrum (upper panel) and several spectra (lower panel) into different DRTs, followed by subsequent analysis to identify the associated electrochemical processes.[9]
4. Synergistic analysis of CV and EIS: bridging mechanisms and performance
The correlation analysis of CV and EIS establishes causal relationships between macroscopic performance degradation and microscopic mechanisms.
4.1 Synergistic diagnosis of high-voltage cycling failure
Studies on O3-type layered oxides under high-voltage (>4.3 V) cycling reveal:
CV shows irreversible oxidation peaks and continuously increasing ΔEₚ[5];
EIS/DRT indicates a sharp increase in charge transfer resistance and the emergence of new relaxation peaks[6].
The synchronous changes in both datasets suggest that electrolyte oxidation decomposition and transition metal dissolution under high voltage lead to thickening of the cathode-electrolyte interface (CEI) layer, thereby increasing charge transfer resistance.

4.2 Validation of interfacial modification strategies
CV/EIS synergistic analysis provides direct evidence for the effectiveness of interfacial modification strategies (e.g., Al₂O₃ coating):
CV shows slower growth of ΔEₚ and better preservation of redox peak symmetry[7];
EIS indicates significantly reduced growth rates of charge transfer resistance and CEI film impedance[8].
This closed-loop validation of "performance–interface–impedance" serves as a quantitative evaluation standard for material modifications.
5. Future prospects: intelligent and high-throughput synergistic analysis
Currently, CV/EIS synergistic analysis is evolving toward automation, intelligence, and high-throughput:
Machine Learning: Deep learning models can identify degradation patterns from raw CV/EIS curves, enabling early failure warnings;
High-Throughput Platforms: Automated testing platforms enable systematic scanning of large material libraries, building "electrochemical fingerprint" databases to accelerate the screening and development of new materials.
6. Summary
The synergistic analysis of CV and EIS not only reveals the dynamic evolution of interfacial reactions but also precisely identifies the microscopic mechanisms of degradation. As sodium-ion batteries move toward industrialization, quantitative and mechanism-based interfacial analysis will become a key support for material design. The CV/EIS synergistic framework will continue to drive the development of high-performance, high-stability cathode materials, supporting the practical application of sodium-ion battery technology.
References
[1] Energy & Environmental Science, 2020, 13, 3457–3487.
[2] Journal of Materials Chemistry A, 2018, 6, 12348–12354.
[3] ACS Applied Materials & Interfaces, 2020, 12, 18853–18862.
[4] Journal of Power Sources, 2019, 414, 210–218.
[5] Nature Communications, 2021, 12, 4907.
[6] Advanced Energy Materials, 2019, 9, 1803215.
[7] Joule, 2022, 6, 1–15.
[8] Nature Reviews Materials, 2023, 8, 276–289.
[9] Wang, Z. et al. ACS Electrochem., 2023. DOI: 10.1021/acselectrochem.5c00334.