1. Introduction
The differential capacity curve (dQ/dV) is used to analyze the relationship between voltage and charge quantity during battery charging and discharging. It provides the derivative of voltage with respect to charge (dQ/dV), enabling rapid identification of phase transformations and reaction kinetics occurring within the battery.
In the previous lecture, "Principles, Example Analysis, and Testing of Battery Differential Capacity (dQ/dV) Curves", we covered the fundamental principles, testing methodologies, parameter settings, and critical considerations for data acquisition related to dQ/dV curve measurement.
This article focuses primarily on the analysis and interpretation of battery differential capacity curves and their associated data.
2. Constant Current Test Parameter Settings
2.1 Test Instrument
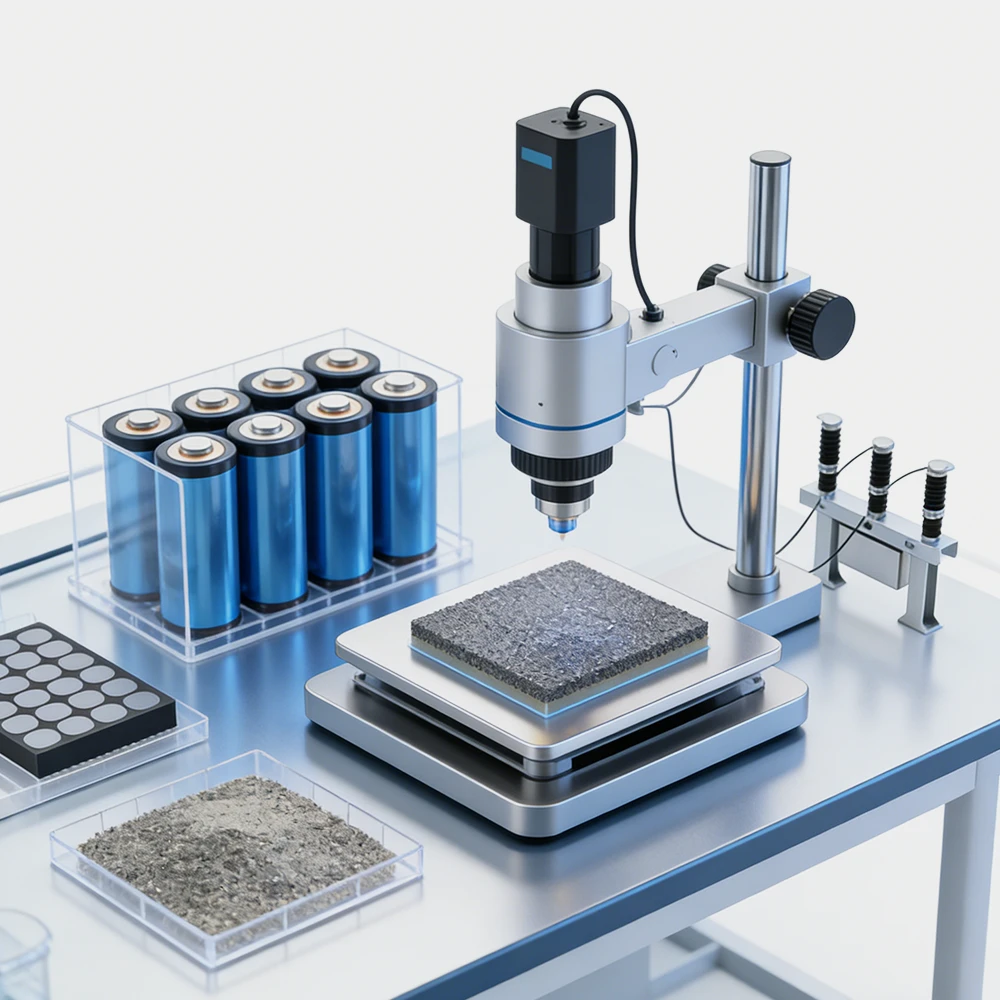
The chapter "Battery Voltage Differential Capacity (dQ/dV) Curve Test Principle and Case Analysis" explained the principle and calculation method of voltage differential capacity dQ/dV. This chapter continues to utilize the NEWARE company's multi-channel battery tester for constant current charge/discharge testing (as shown in Figure 1), to obtain the corresponding constant current charge/discharge curves. These curves are then processed via software to derive the dQ/dV curve for analysis.

Figure 1. NEWARE battery testing system
dQ/dV Curve Explanation: The dQ/dV curve requires the battery's redox reaction to proceed to completion in order for the redox peaks to appear. Furthermore, since this process employs a constant current, the diffusion rate remains constant. Consequently, the measured potential changes are relatively accurate, enabling non-destructive analysis of the battery's redox reaction.
2.2 Parameter Settings

Figure 2. Various Test Current Density Settings

Figure 3. Time and Voltage Recording Parameter Settings
The above test parameters are for reference only. Specific test parameters should be determined based on the material properties and battery assembly method.
2.3 Acquisition of Constant Current Charge/Discharge Data
After configuring the parameters as described above, upon completion of the test, select the corresponding cycle number (as shown in Figure 4).
![]()
Figure 4. Cycle Range Selection
Within the green box in Figure 4, the cycle range can be directly entered. Pressing the Enter key will select this range. Alternatively, double-clicking the red box allows input of the range. This will generate the constant current charge/discharge curve as shown in Figure 5.

Figure 5. Charge-discharge curves at different current densities
3. Acquisition and Analysis of dQ/dV Curves
3.1 Acquisition of dQ/dV Curves
Open the software and select the desired cycle number to obtain the constant current charge/discharge curve. Following the procedures outlined in the chapter "Battery Voltage Differential Capacity (dQ/dV) Curve Test Principle and Case Analysis", generate the dQ/dV curve plot, as shown in Figure 6.
 dQ/dV curve and (b) charge-discharge profile")
Figure 6. (a) dQ/dV curve and (b) charge-discharge profile
3.2 Analysis of dQ/dV Curves
 dQ/dV curve and (b) charge-discharge profile during the initial cycle at 0.1 A g⁻¹ current density")
Figure 7. (a) dQ/dV curve and (b) charge-discharge profile during the initial cycle at 0.1 A g⁻¹ current density
Figure 7a reveals that the material exhibits multiple redox peaks within the voltage range of 0.2-1.2 V, indicating good electrochemical activity. This observation aligns with the charge/discharge curves over the same voltage range (0.2-1.2 V). Furthermore, a sharp peak appears during the 1.4-1.6 V process, signifying a rapid redox reaction. The high peak intensity suggests strong electrochemical activity in the material. Based on previously reported literature, this process is attributed to an irreversible phase transition occurring in the vanadium-based material. This phenomenon is corroborated by the long plateau observed in the charge/discharge curve (1.4-1.6 V, Figure 6b).
 dQ/dV curves and (b) charge-discharge profiles during cycles 2-5 at 0.1 A g⁻¹ current density") \
\
Figure 8. (a) dQ/dV curves and (b) charge-discharge profiles during cycles 2-5 at 0.1 A g⁻¹ current density
As shown in Figure 8, the material exhibits dQ/dV and charge/discharge curves distinct from those of the first cycle, providing further evidence of the irreversible phase transition occurring during the initial charge/discharge process. Three reduction peaks appear during the discharge process at 0.96 V, 0.90 V, and 0.65 V, indicating a multi-step Zn2+/H+ intercalation process. This multi-step behavior is favorable for multi-electron redox reactions, enabling high capacity. The peak at 0.65 V is notably higher in intensity and sharper than the other two, suggesting a faster redox reaction rate at this potential. Three oxidation peaks appear during the charging process at 0.71 V, 0.97 V, and 1.07 V, corresponding to the multi-step Zn2+/H+ deintercalation process. Additionally, the peak shapes and positions gradually coincide with cycling, indicating enhanced stability and electrochemical reversibility of the material.
 dQ/dV curves and (b) charge-discharge profiles during cycles 1-5 at 20 A g⁻¹ current density")
Figure 9. (a) dQ/dV curves and (b) charge-discharge profiles during cycles 1-5 at 20 A g⁻¹ current density
Figure 9 shows that when the current density increases to 20 A g−1, significant changes occur in the peak profiles due to increased polarization. The positions of the redox peaks shift noticeably, and some even disappear. As cycling proceeds, the curves gradually overlap, accompanied by an increase in peak intensity. This demonstrates that the material maintains good electrochemical reversibility for zinc storage, with fast redox reaction kinetics, even at high current densities.
3.3 Analysis of dQ/dV Curves During Cycling
 Charge/Discharge Curves and (b) dQ/dV Curves at a Current Density of 20 A g⁻¹")
Figure 10. Selected (a) Charge/Discharge Curves and (b) dQ/dV Curves at a Current Density of 20 A g⁻¹
As depicted in Figure 10a, the specific capacity of the material decreases and the polarization voltage increases with cycling, indicating a decline in structural stability. Processing this data yields the dQ/dV curve shown in Figure 10b. This curve reveals a gradual decrease in peak intensity and significant shifts in the positions of the redox peaks with cycling, signifying a reduction in the activity and structural stability of the electrode material. Furthermore, the broadening of the peaks with cycling indicates a slowdown in ion diffusion rate within the material, further corroborating the results observed in the charge/discharge curves.
3.4 Key Points for dQ/dV Curve Analysis
Voltage Plateaus: Horizontal regions on the dQ/dV curve correspond to voltage plateaus in the battery's charge/discharge process, indicating minimal change in reaction potential within those voltage intervals.
Redox Peaks: Peaks on the curve typically represent redox reactions of the battery material. The peak position corresponds to the specific potential at which the electrochemical reaction occurs.
Peak Width: The width of a peak reflects the kinetics of the electrochemical reaction. Narrower peaks usually indicate faster kinetics, while broader peaks may suggest slow ion diffusion or electron transfer.
Peak Area: The area under a peak relates to the amount of material involved in the reaction and can be used to estimate capacity changes within a specific potential range.
Peak Symmetry: Symmetrical peak shapes often indicate a reversible electrochemical reaction, whereas asymmetrical peaks may suggest irreversibility or the presence of multiple reaction steps.
Peak Shift: The horizontal distance between charge and discharge peaks reflects the degree of battery polarization. A larger distance indicates more severe polarization.
Multiple Peaks: The presence of multiple peaks may indicate that several electrochemical reactions occur within the battery material or that different active sites exist.
Peak Evolution: Comparing dQ/dV curves from different cycle numbers or under different conditions allows observation of battery performance changes, such as capacity fade or material structural evolution.
Background Current: The baseline of the curve should ideally be flat. Any deviation from the baseline may indicate parasitic reactions or other internal current flow within the battery.
Curve Reproducibility: The reproducibility of dQ/dV curves can be used to assess battery reliability and consistency.
Correlation with CV Curves: Peaks in dQ/dV curves generally correspond to peaks in Cyclic Voltammetry (CV) curves. However, dQ/dV curves can provide more detailed information, especially regarding subtle changes near the peaks.
4. Summary
dQ/dV is a graphical representation used to analyze the relationship between voltage and capacity changes during battery charge/discharge. This type of curve provides detailed information on battery charge/discharge behavior, enabling researchers to gain deeper insights into the kinetics of electrochemical reactions, material reversibility, and the long-term stability of the battery.